Note: This tutorial is adapted from the ENNA course on Cisco U. If you find this helpful, consider taking the full course.
What You’ll Learn
- Verifying overall network device health
- Troubleshooting network device issues
- Verifying with the network device 360 view
What You’ll Need
- Cisco Catalyst Center and associated devices
In this tutorial, you will investigate a scenario where clients reported sporadic problems with network connectivity. The clients reporting the network problem are all connected to the same access switch, so the focal point of the investigation will be that particular access switch.
You will troubleshoot the network problem by examining the health of the network, as reported by Cisco Catalyst Center Assurance.
You will begin by examining the Catalyst Center overall network health dashboard, which provides performance graphs and lists the top issues for network devices and clients.
You will then move on to the network dashboard for more details on the health of network devices in order to determine if the reported problem results in decreased health of any network device.
Once you locate a device with decreased health, you will use the device 360 view to gather more information about the device. Finally, you will look at Catalyst Center issues to determine the root cause for the reported network problem.
Getting Started with the Assurance Summary
Note: The lab environment is not available for this tutorial. However, the screenshots and steps are provided for your reference.
Begin by exploring the Assurance Summary on the Catalyst Center homepage. This section is your gateway to understanding the current health status of your network, displaying vital metrics and trends.
Note: Although Cisco DNA Center is now called Cisco Catalyst Center, the screenshots shown in this tutorial still display the former name. The user interface is otherwise the same.
Step 1:
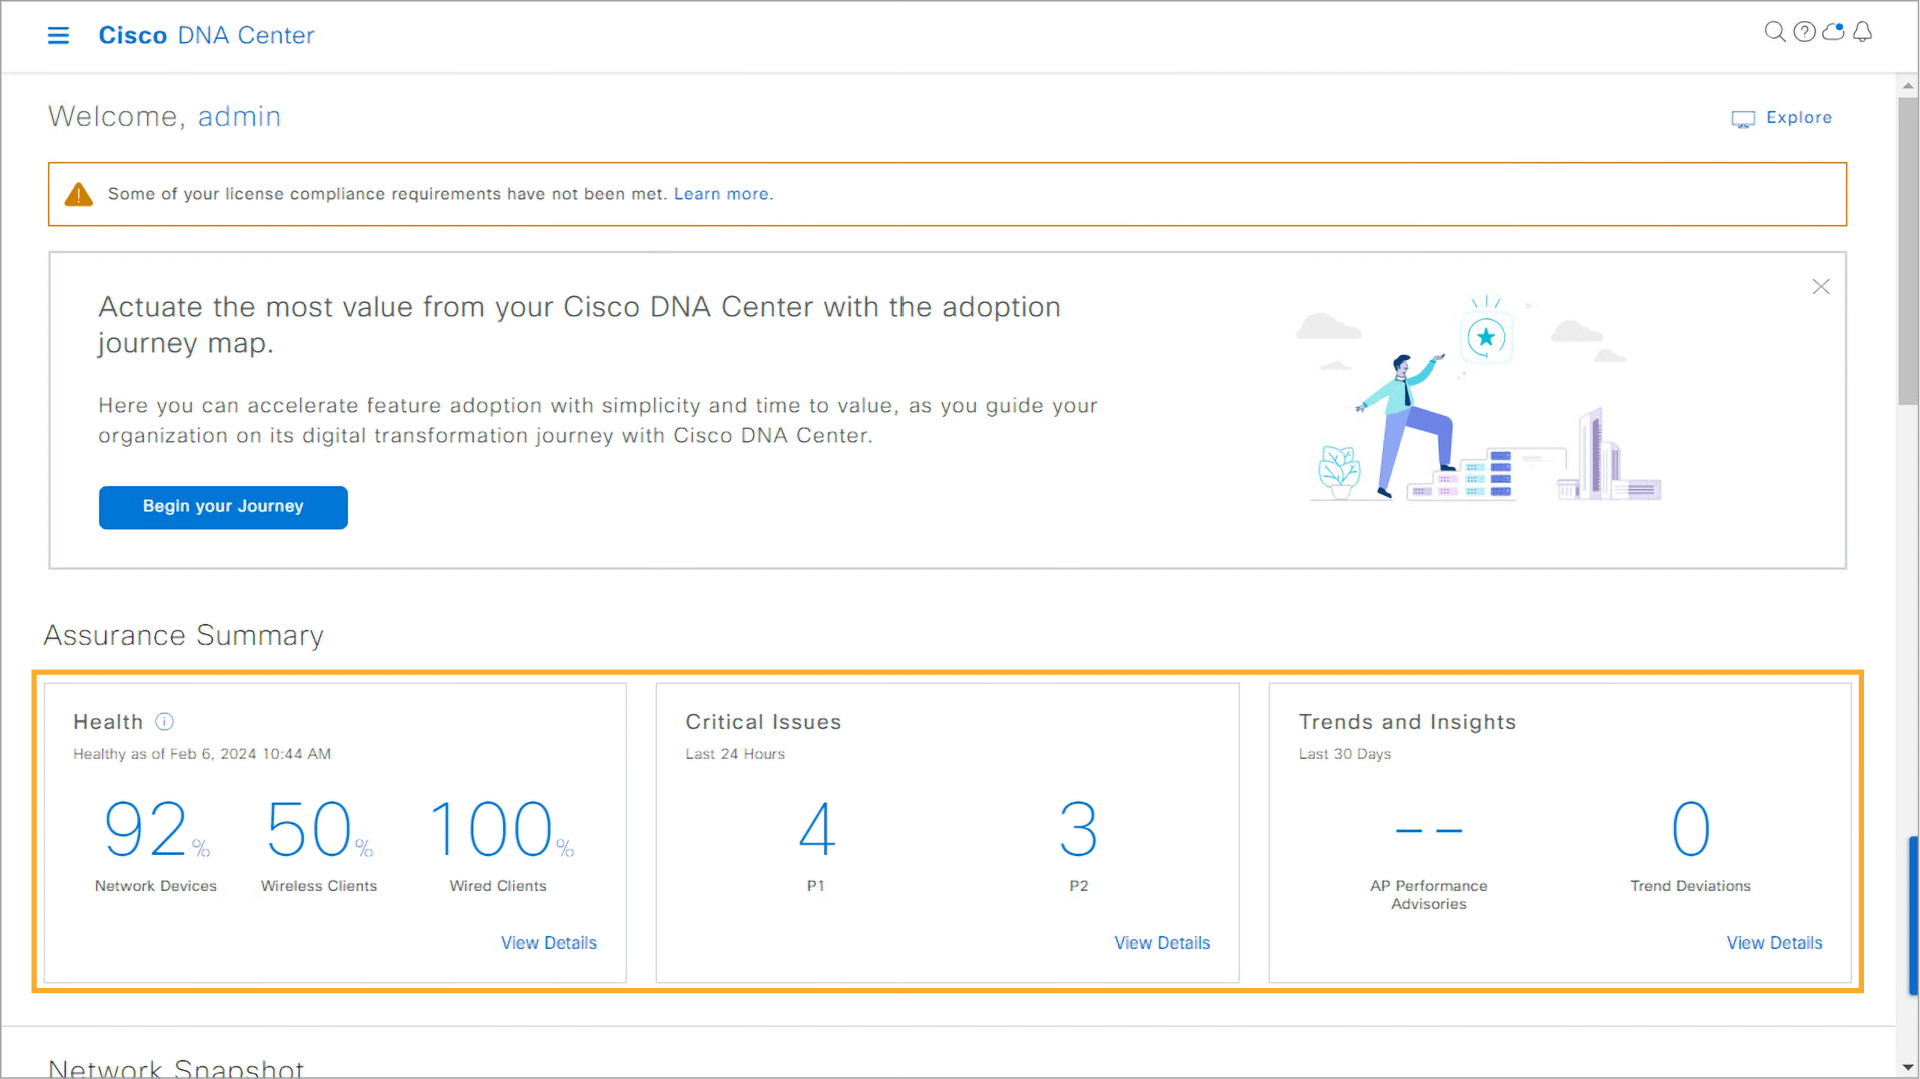
- On the Catalyst Center homepage, observe the Assurance Summary section, which provides a quick snapshot of your network’s health.
- The Health dashlet displays the percentage of healthy network devices based on scores calculated every 5 minutes for the overall enterprise.
- The Critical Issues dashlet displays the total number of priority 1 and priority 2 issues that are detected within the last 24 hours.
- The Trends and Insights dashlet displays long-term behavioral trends and performance insights observed over a period.
Step 2:
- Open the details of the Health dashlet to examine the overall health of your enterprise. In the Assurance Summary section, click View Details inside the Health dashlet.
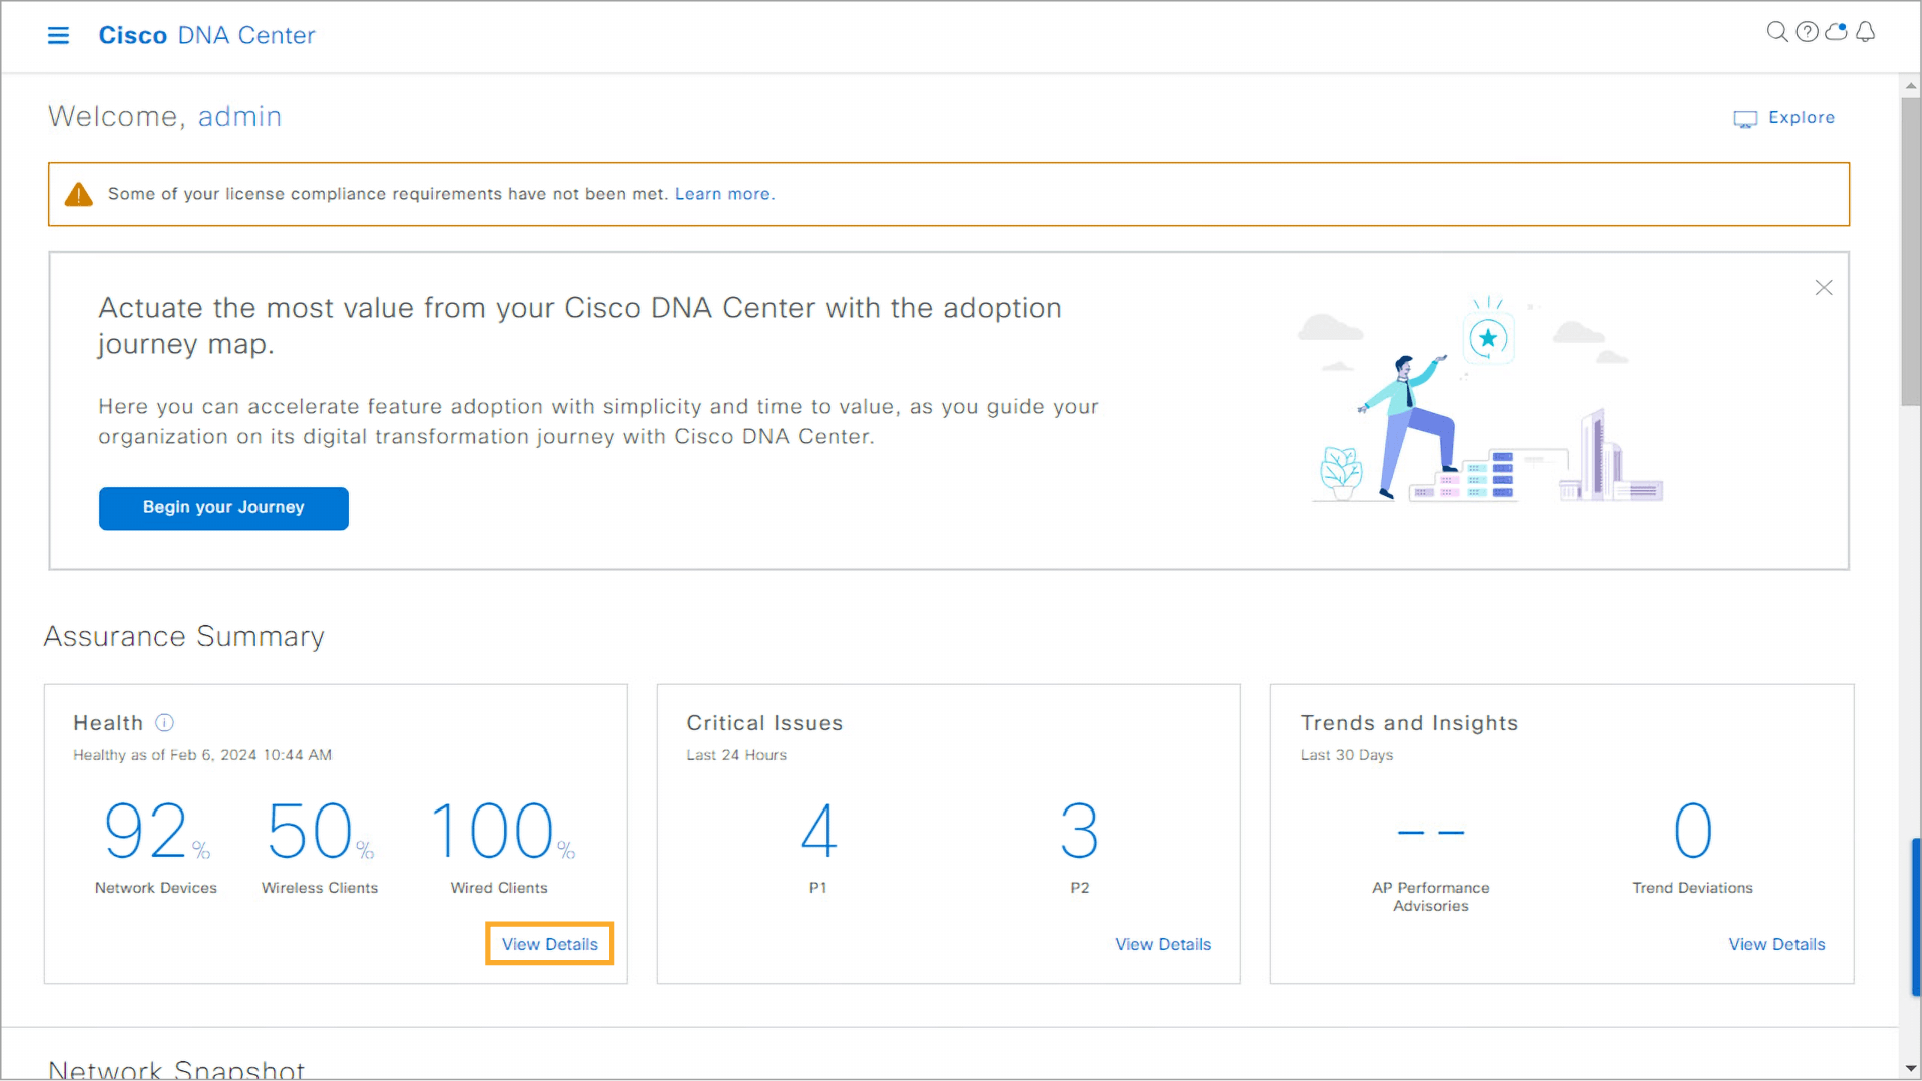
Note: In a real environment, you could also open the Catalyst Center menu and navigate to Assurance > Health to examine the overall health.
Step 3:
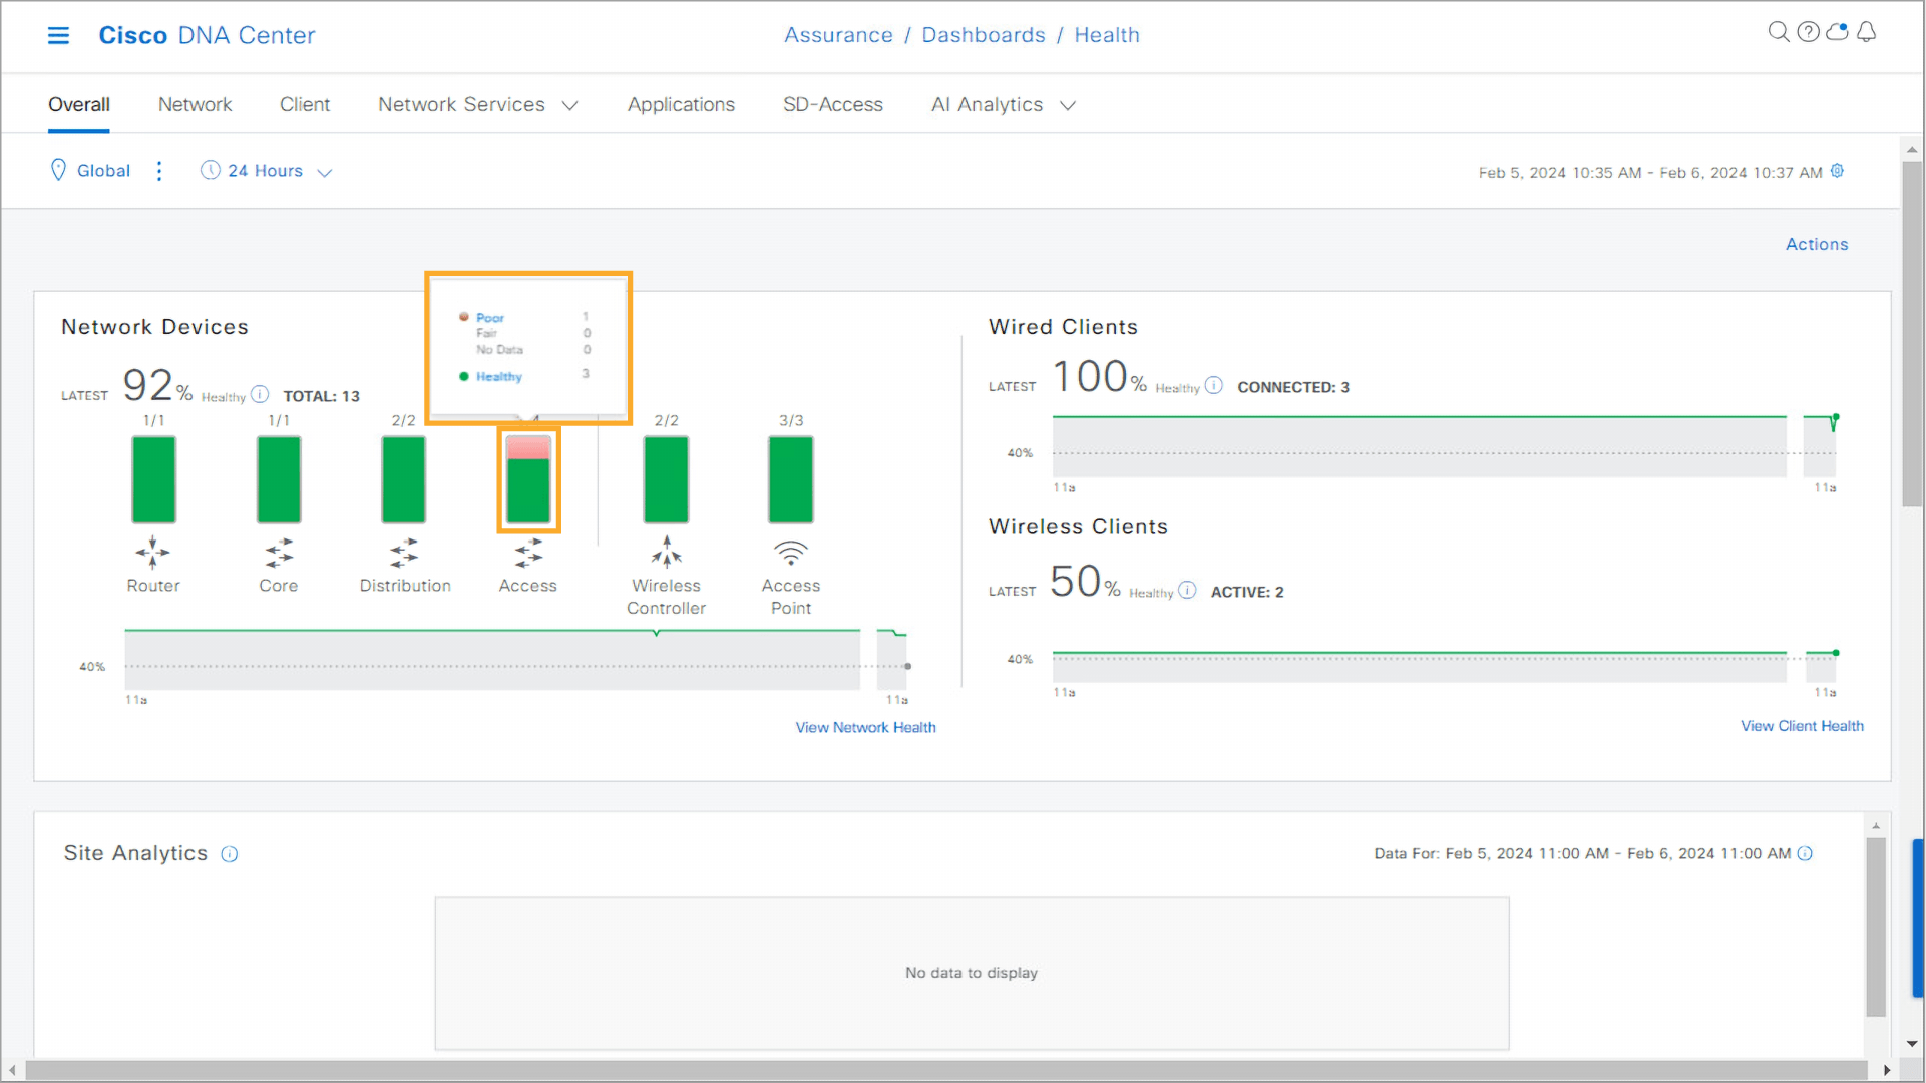
- The Overall Health dashboard provides a snapshot of statistics for the entire enterprise.
- The Network Devices dashlet displays the percentage of healthy devices by device type or the assigned switch role. View the health score details for the access switches.
- You can see that some of the access switches have poor health. Click the Access graph. In a real environment, you can hover your mouse over the graphs to see more information. You see the number of access switches with poor health. The pop-up window displays the totals for switches with a poor, fair, or healthy status.
- You can see that one access switch has poor health, which is most likely the reason for clients experiencing connectivity issues.
Note: To continue with Step 4, proceed to the next topic.
Step 4:
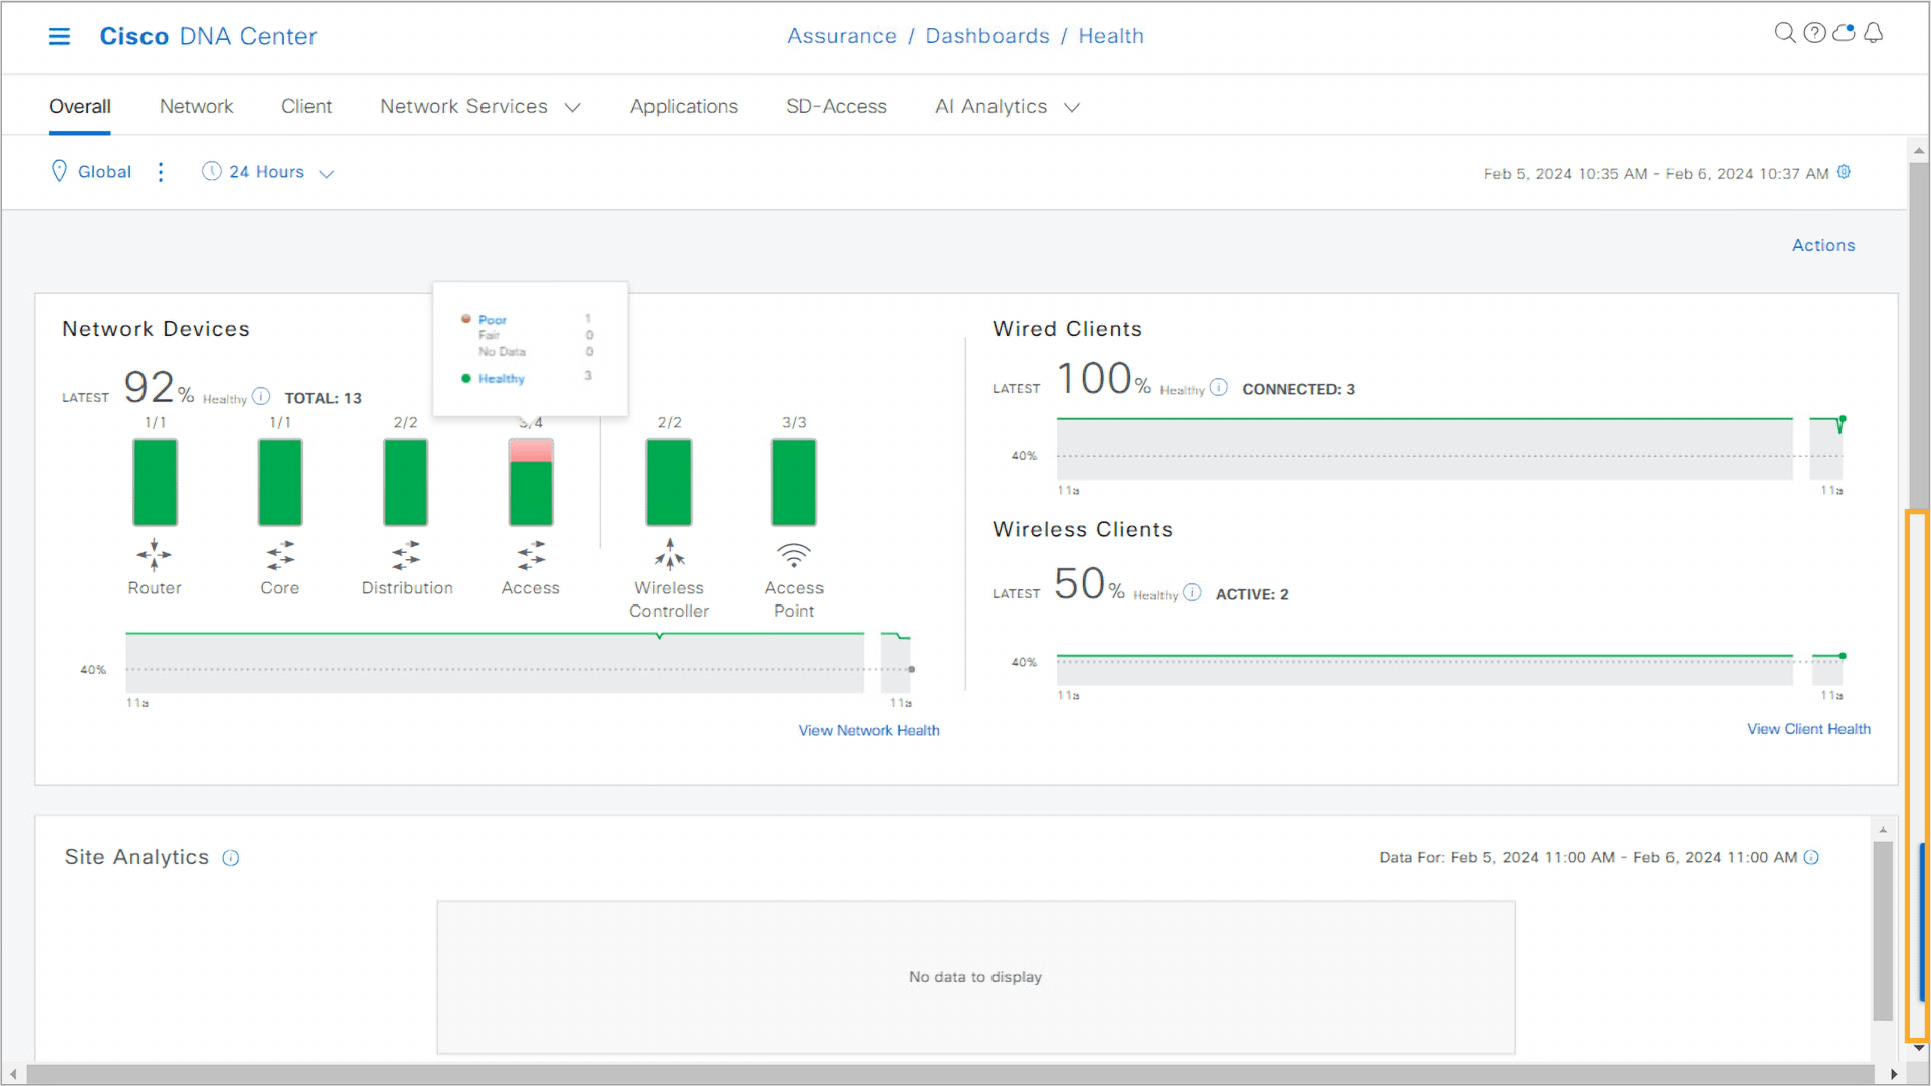
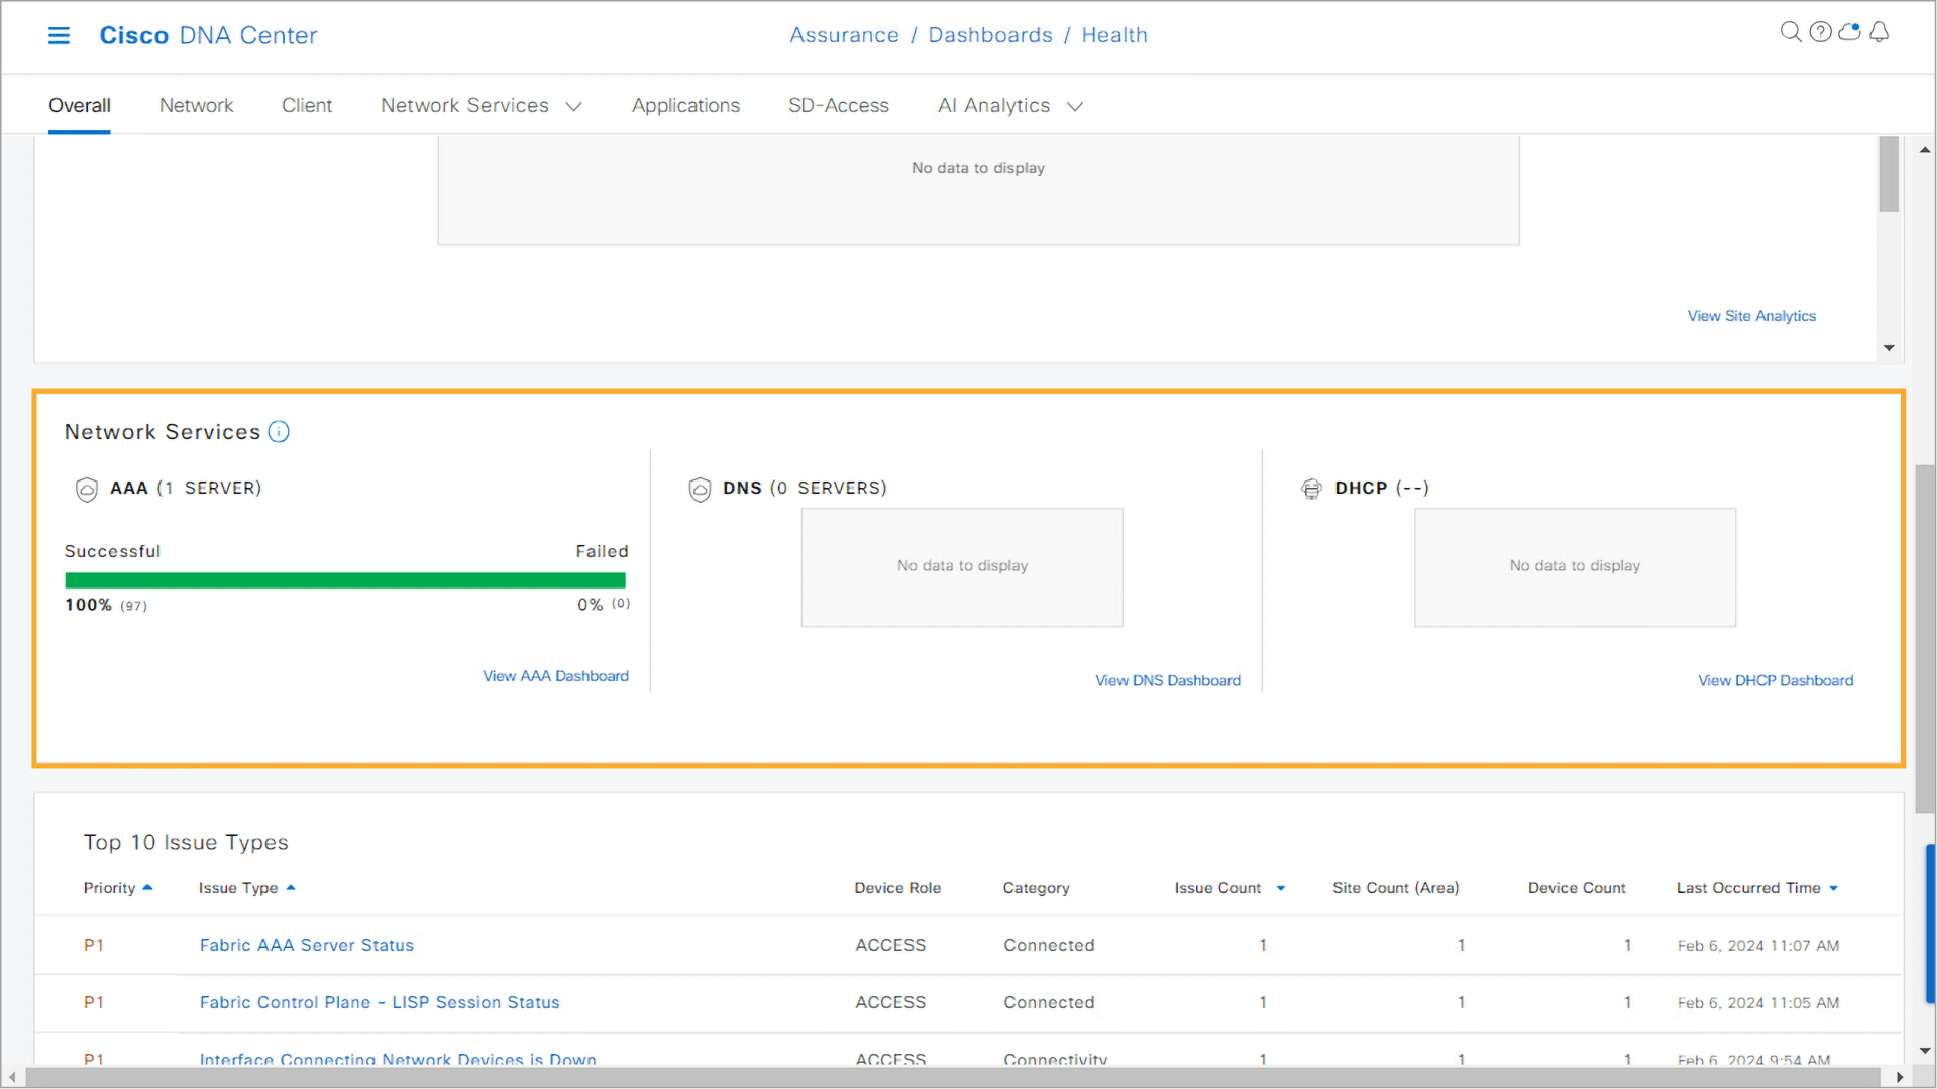
- Click the bottom of the scroll bar to the right once to navigate to the Network Services dashlet. The scrolling functionality is not supported in this simulated environment.
- This dashlet reports availability of authentication, authorization, and accounting (AAA), Domain Name System (DNS), and DHCP services as reported by the Cisco Wireless LAN Controller (WLC).
Step 5:
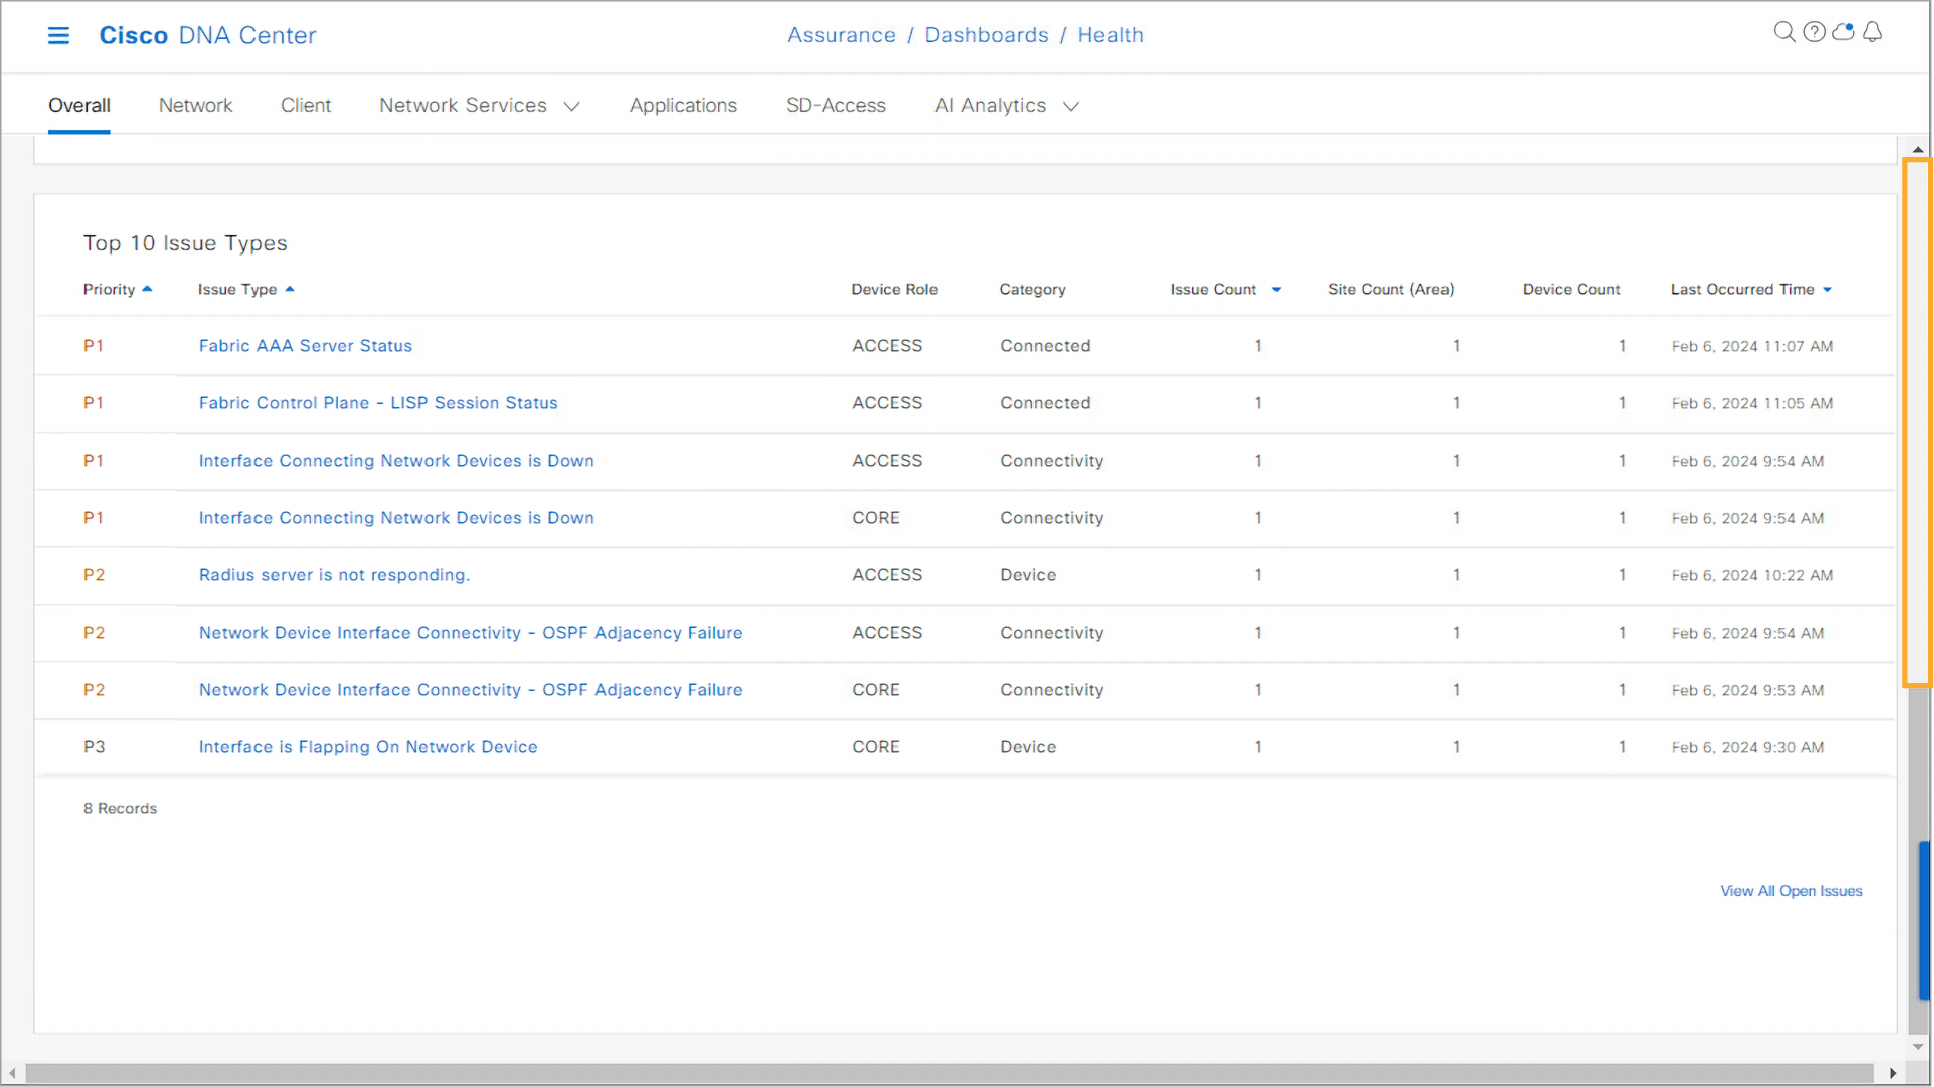
- Click the bottom part of the scroll bar to the right again to navigate to the Top 10 Issue Types dashlet. The scrolling functionality is not supported in this simulated environment. This dashlet lists the detected issues.
- The issues are categorized in four categories:
- P1: Priority 1 indicates a critical issue that requires immediate attention.
- P2: Priority 2 indicates a major issue with potential impact on multiple devices.
- P3: Priority 3 indicates a minor issue with minimal impact.
- P4: Priority 4 indicates a warning and may not be an immediate problem.
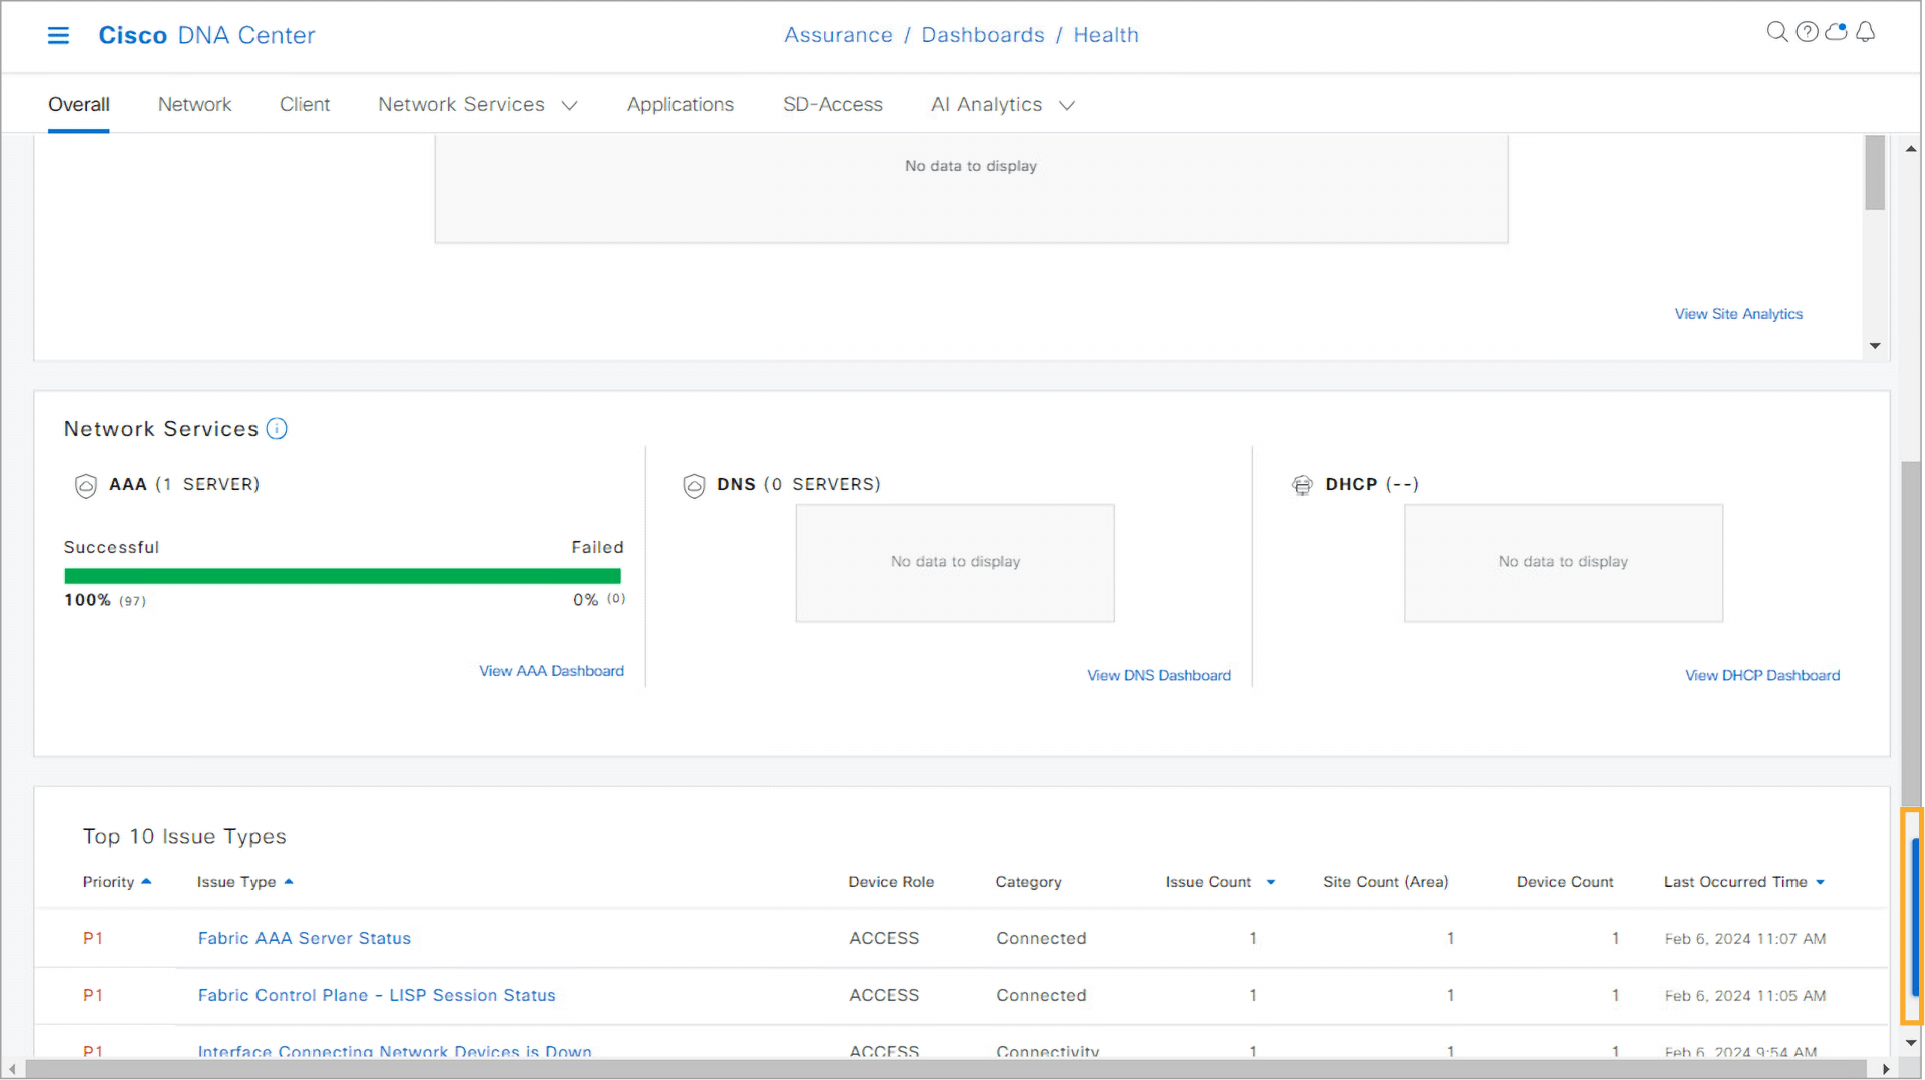
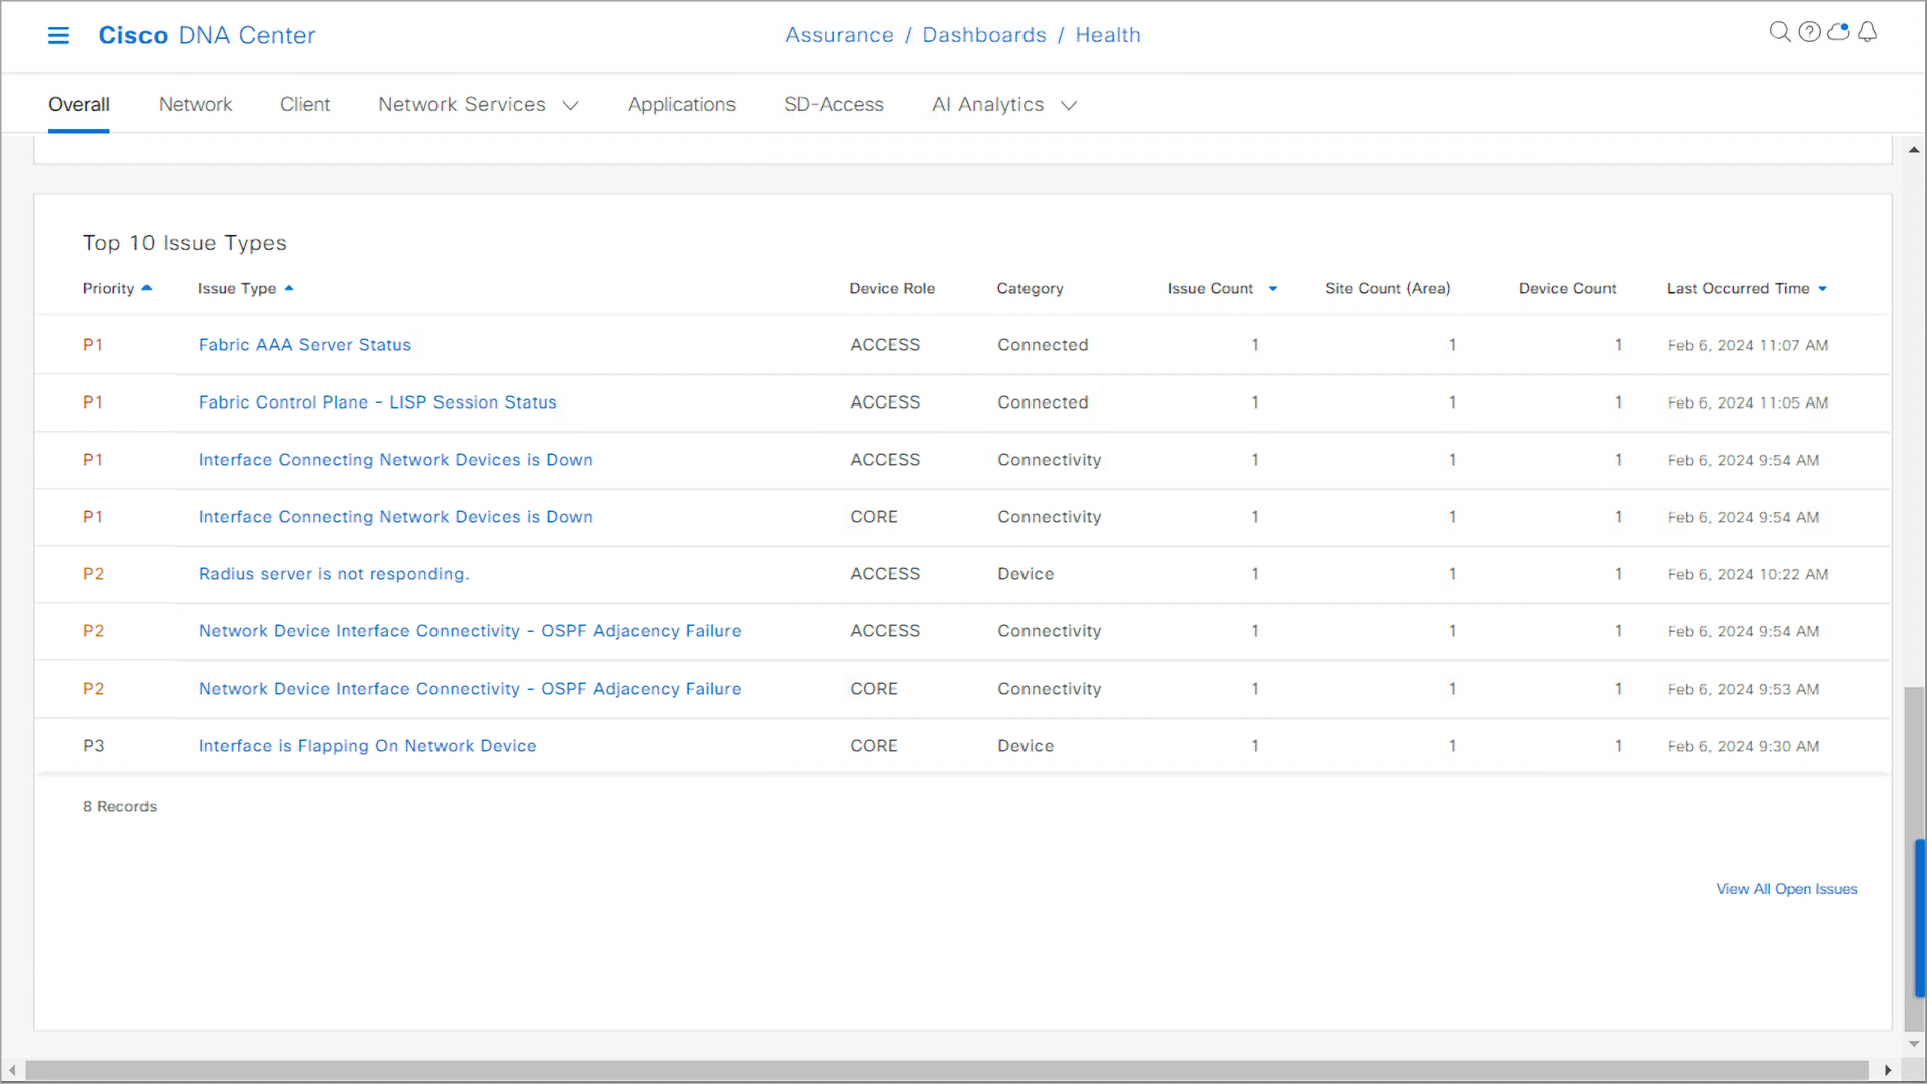
Notice several issues detected in the network that could cause connectivity issues. In a real environment, you can examine the issues from here.
Note: To continue with Step 6, proceed to the next topic.
Next, leverage the Network Health dashboard to gain insights into the temporal health trends of network devices, an important step in identifying patterns that may correlate with network issues.
Step 6:
- Click the top part of the scroll bar to the right to scroll back up to the top of the page. Inside the Network Devices dashlet, click View Network Health.
Note: In a real environment, you can click the Network tab in the same window to open the Network Health dashboard.

Step 7:
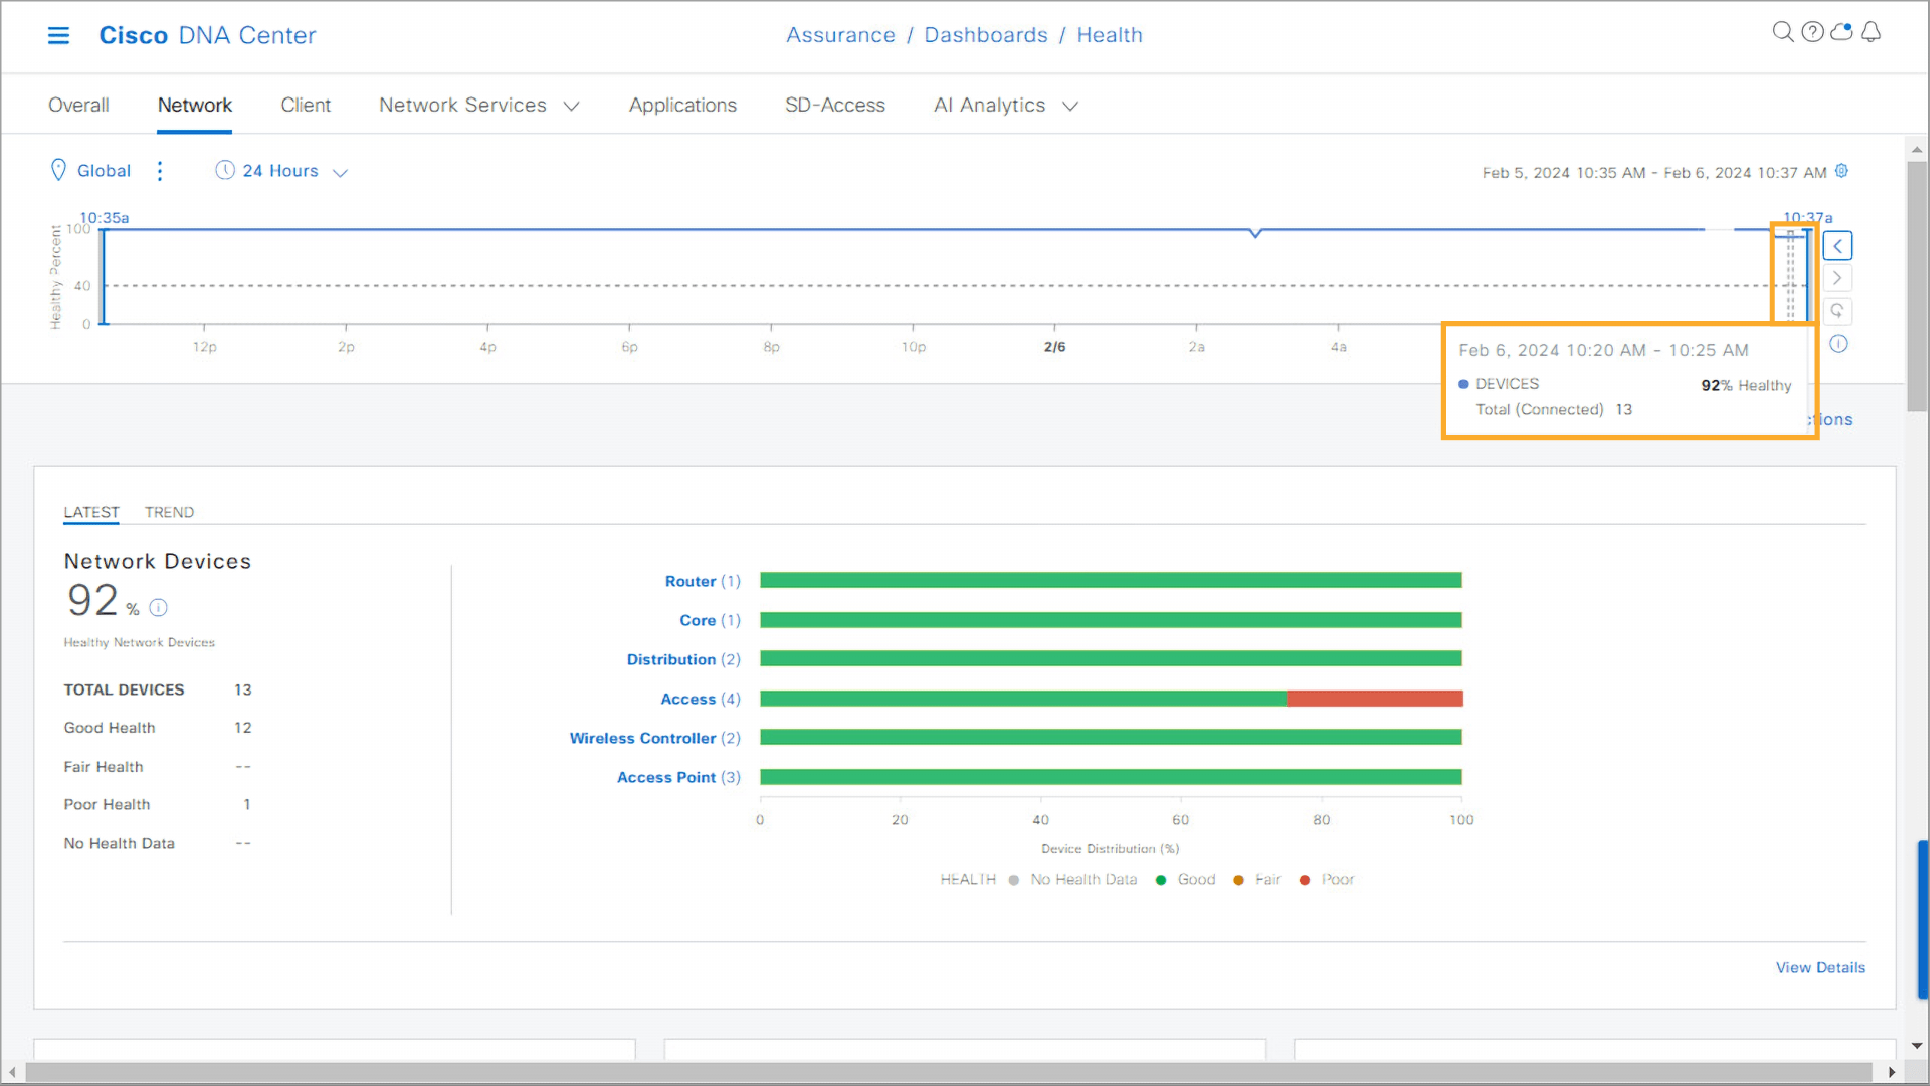
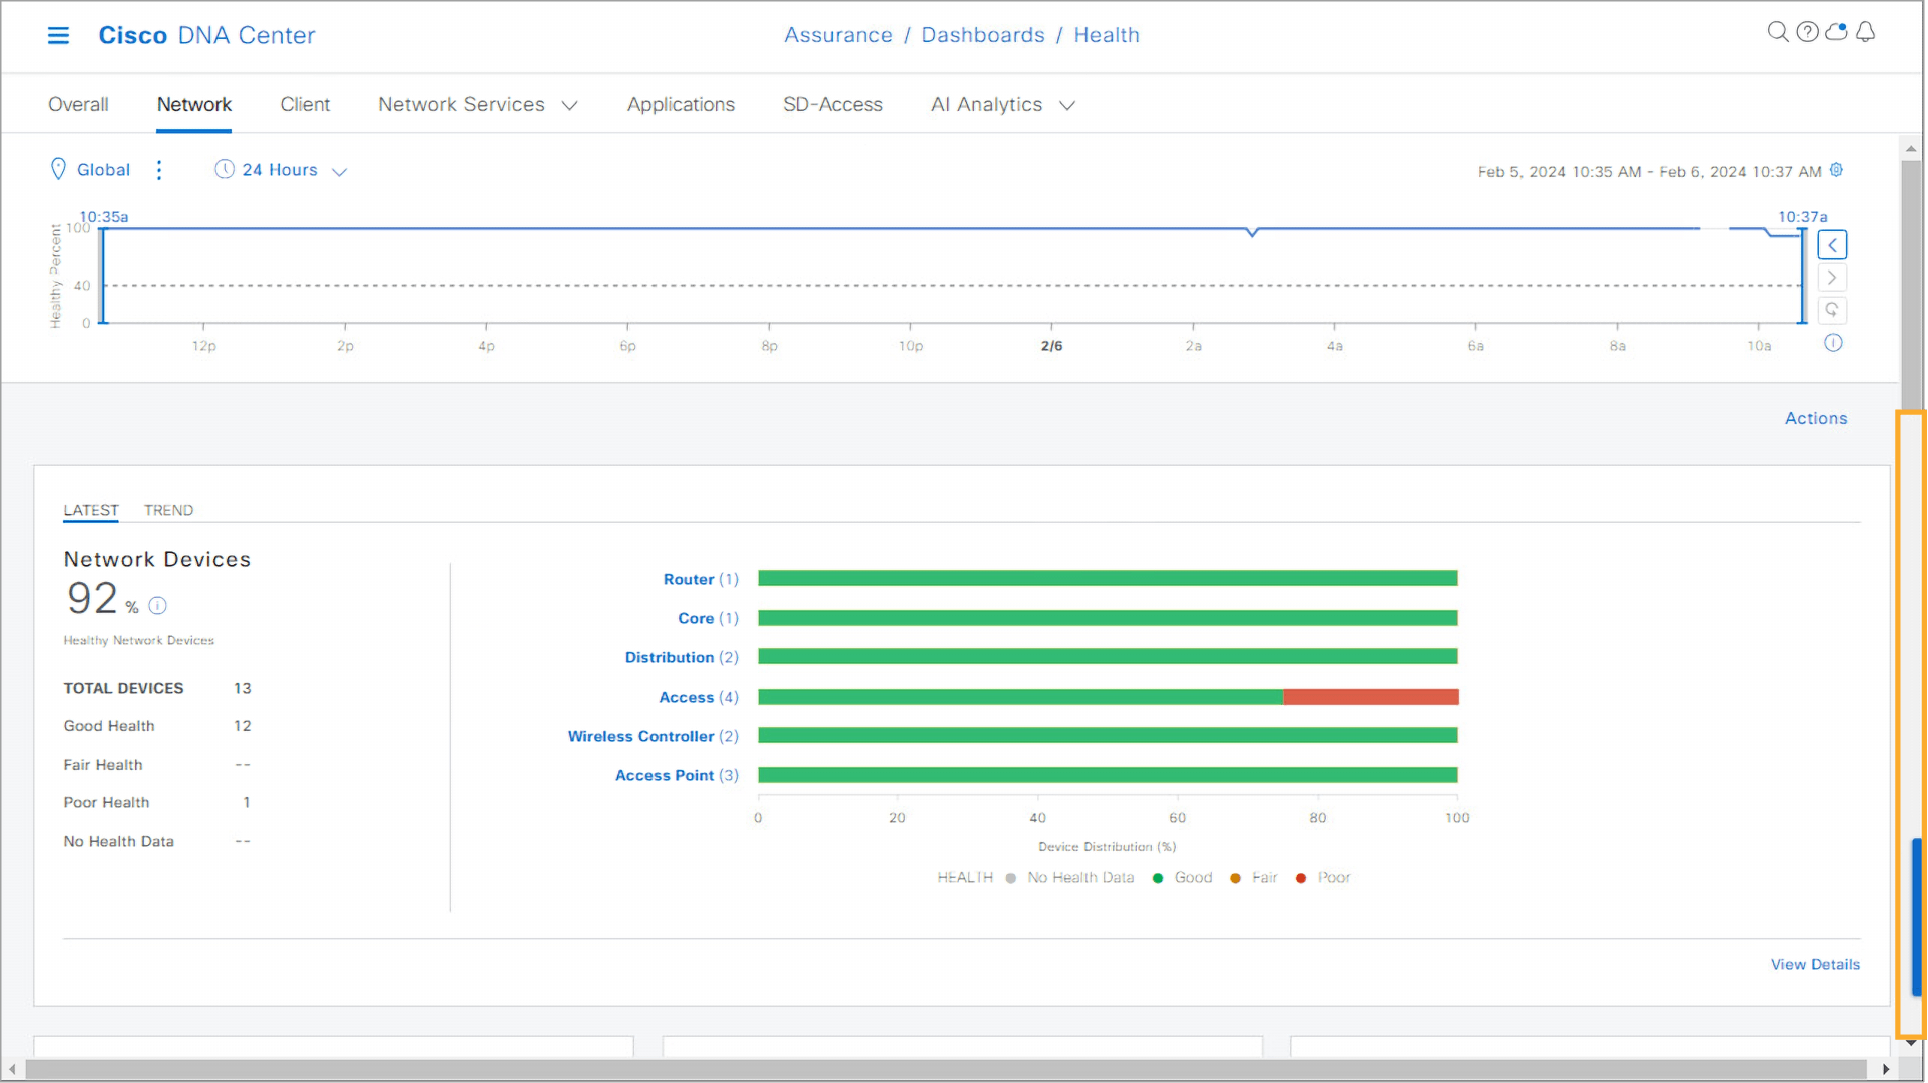
- Examine the Network Health dashboard. On the timeline, locate the time of decrease in the number of healthy devices. Click the right side of the timeline, where the decrease in the number of healthy devices was detected. A pop-up window appears, displaying that out of 13 devices, 92 percent are healthy.
Note: To continue with Step 8, proceed to the next topic.
With a better understanding of networkwide health, it’s critical to zoom in on the access switches. These switches are often the frontline of connectivity issues and can reveal much about the network’s operational status.
Step 8:
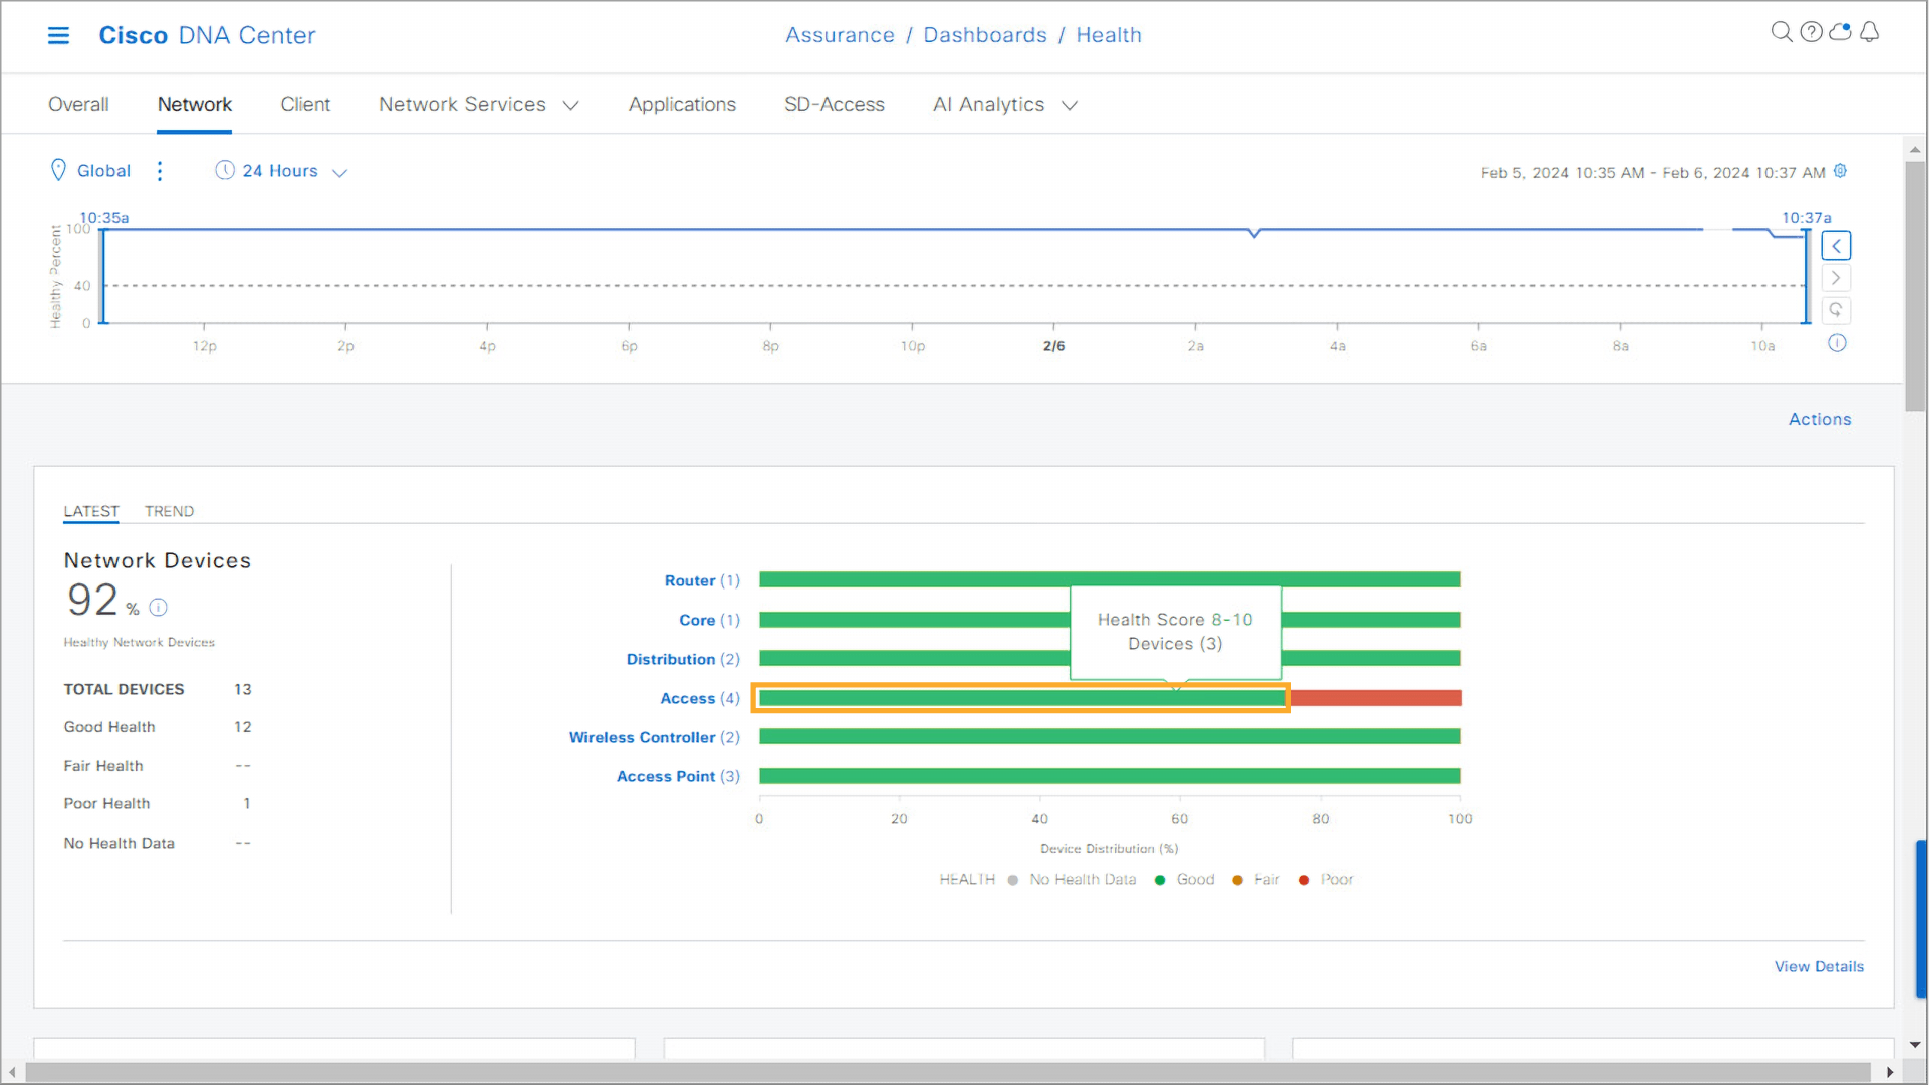
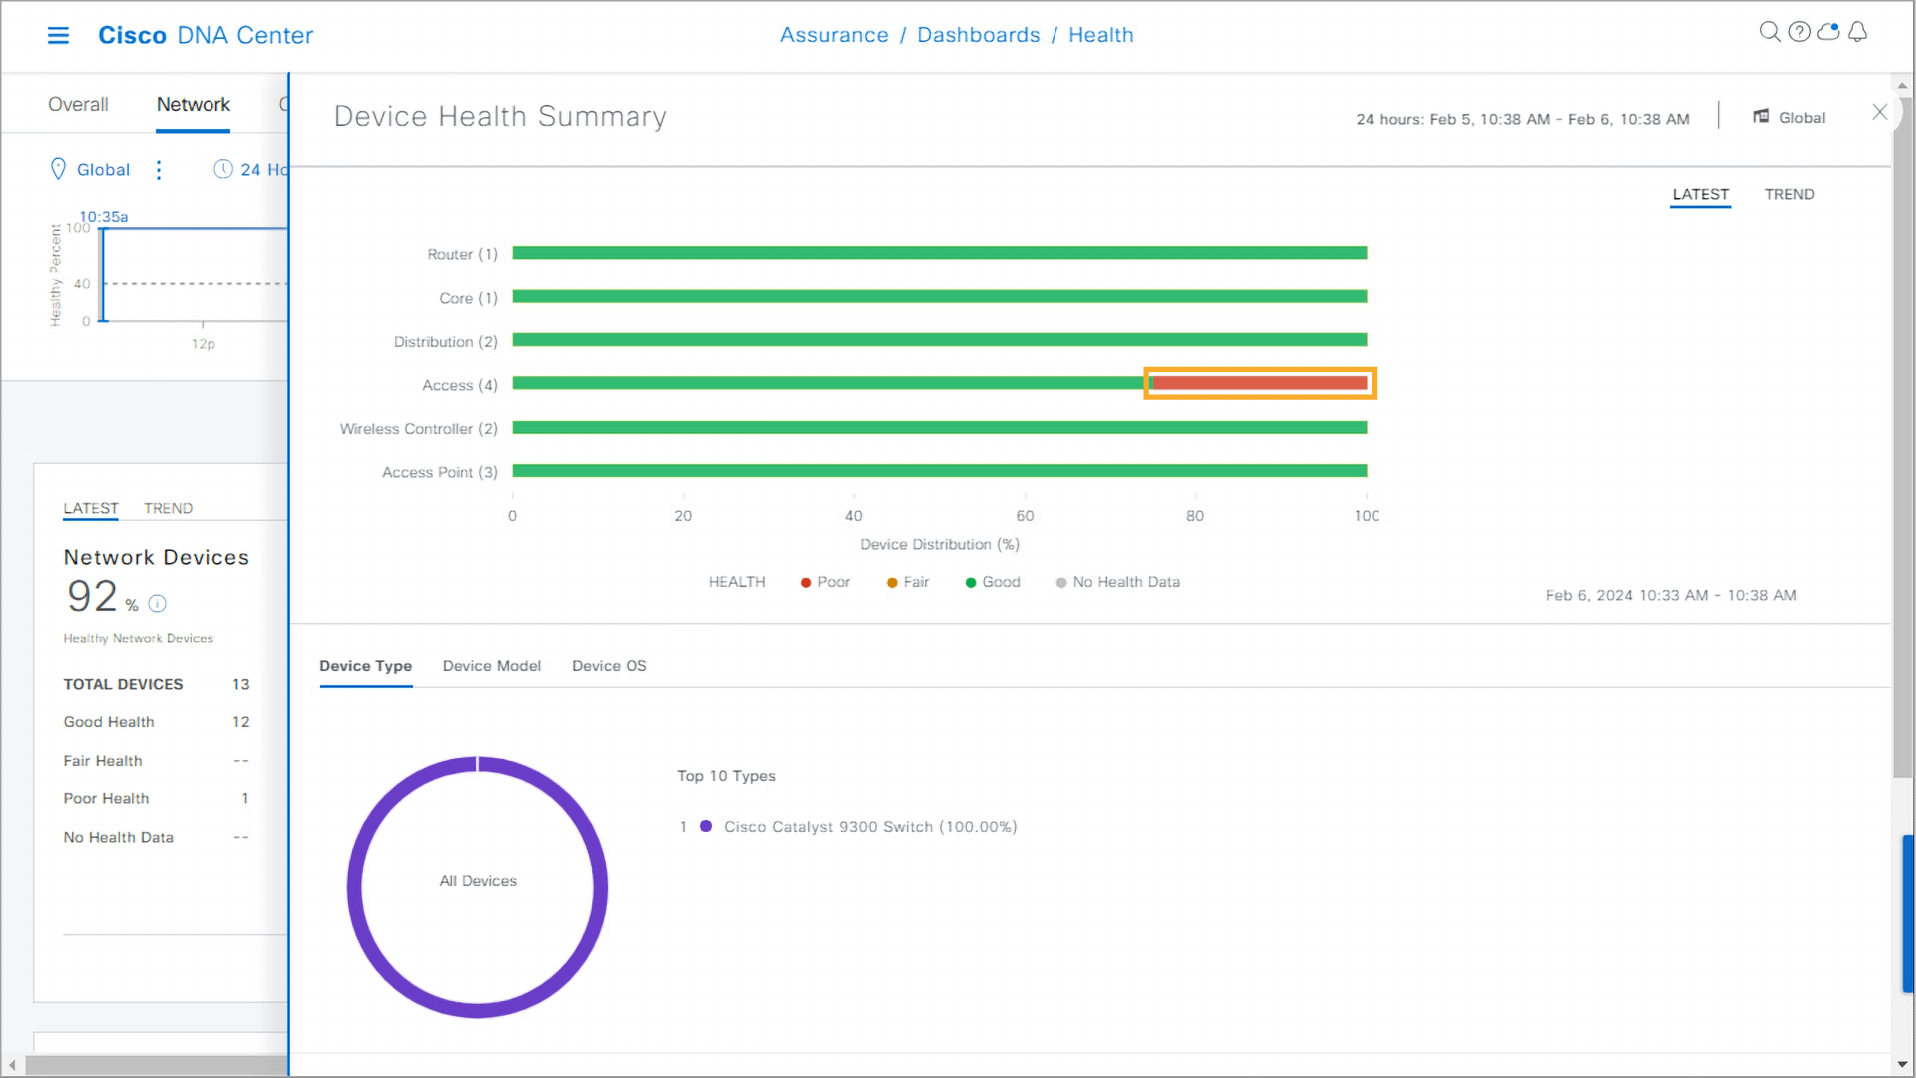
- Examine the Network Devices dashlet. Focus on the access switches and their health.
- The Network Devices dashlet displays a bar graph with distribution of health for different device category types:
- Red indicates devices with poor health.
- Orange indicates devices with fair health.
- Green indicates devices with good health.
- In the Access category, click the green area to see the number of access switches with good health. A pop-up window shows that three switches have good health. In a real environment, you can hover your mouse over each graph bar to see more information.
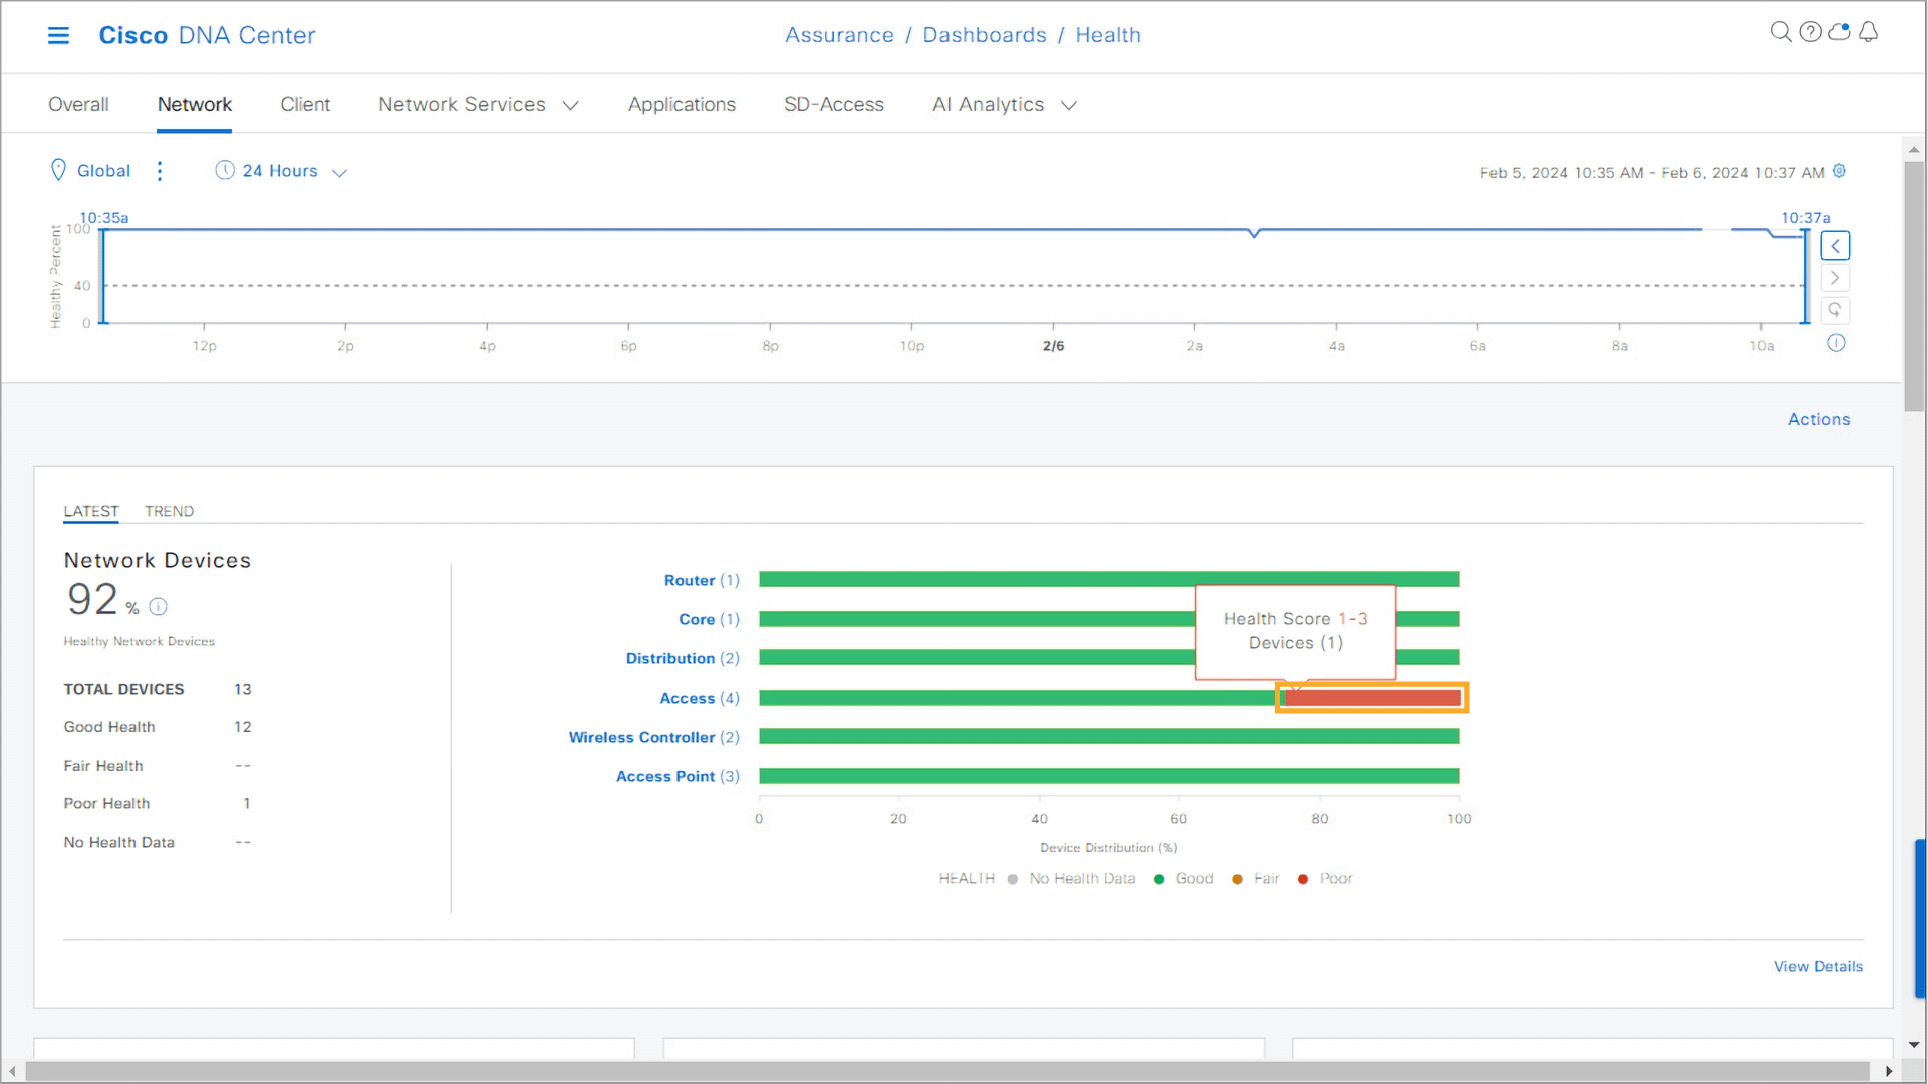
Step 9:
- In the Access category, click the red area to see number of access switches with poor health. A pop-up window shows that one switch has poor health. In a real environment, you can hover your mouse over each graph bar to see more information.
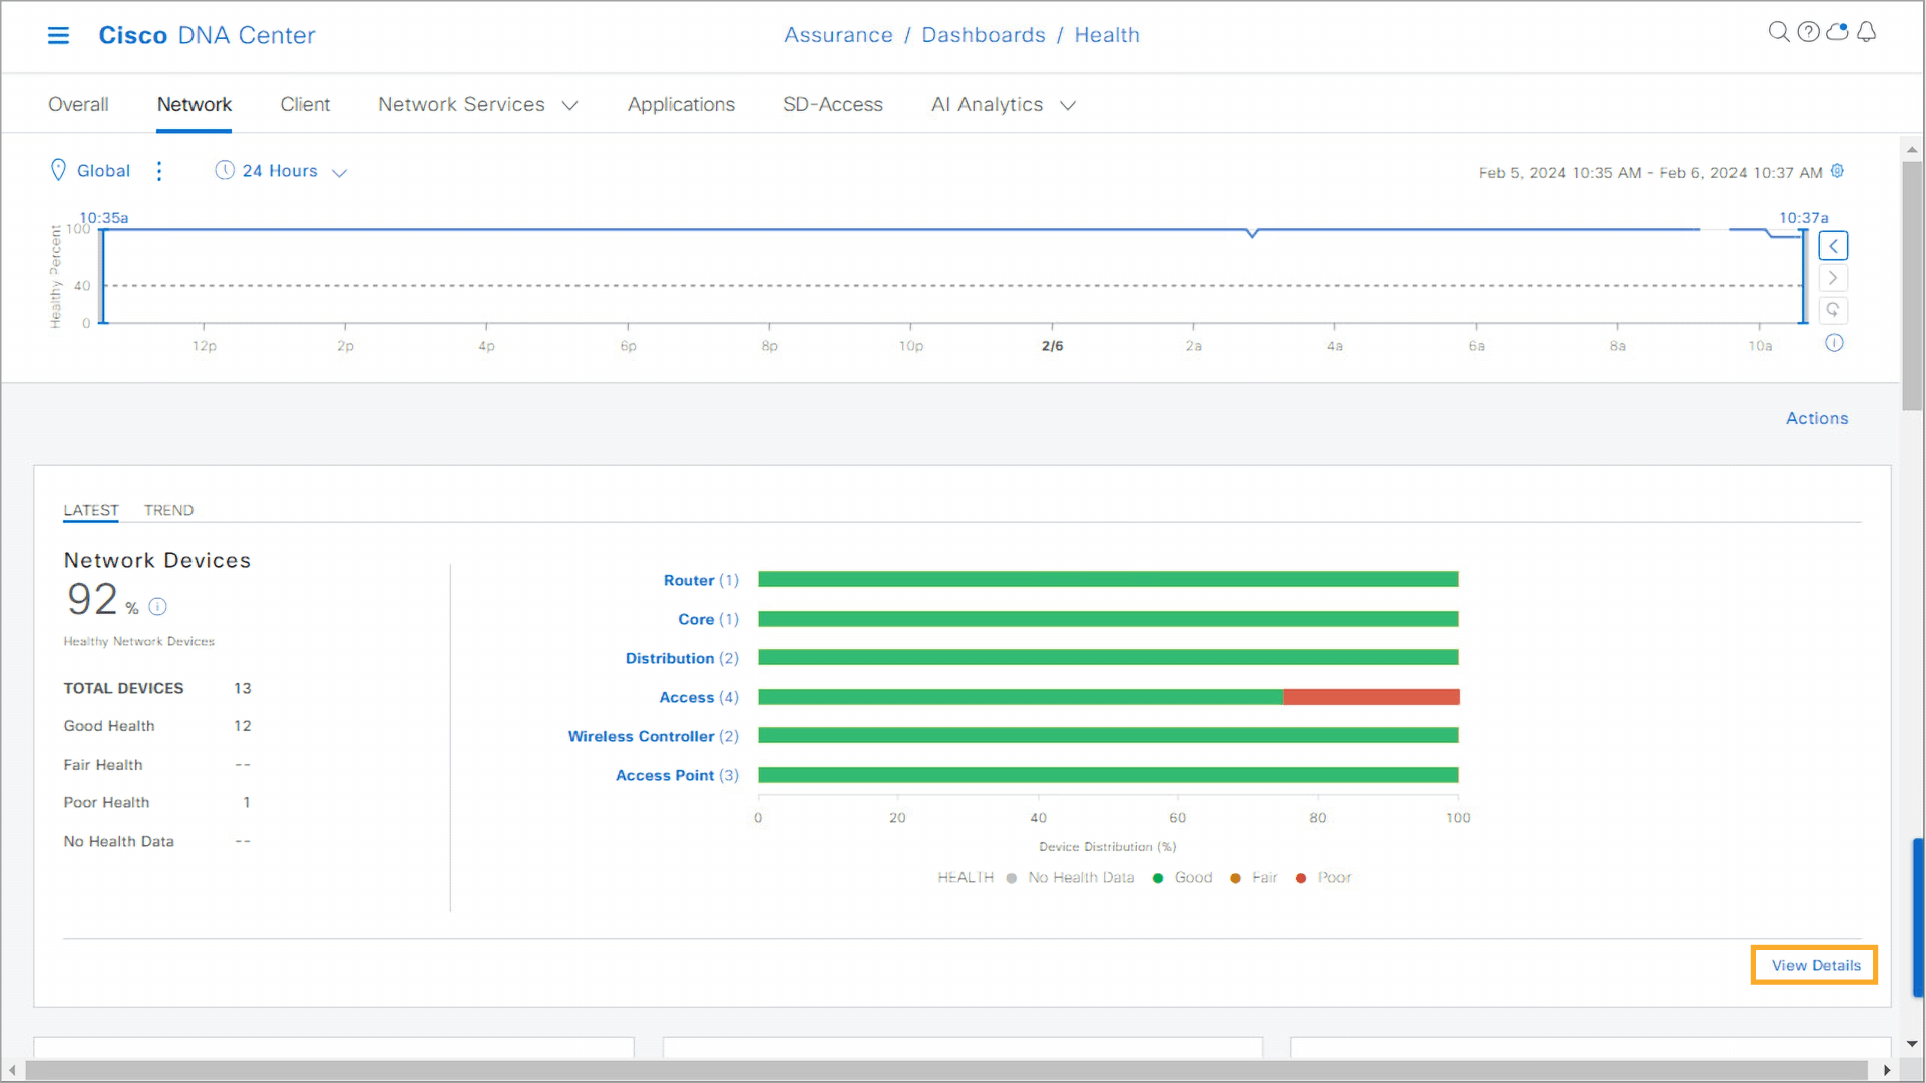
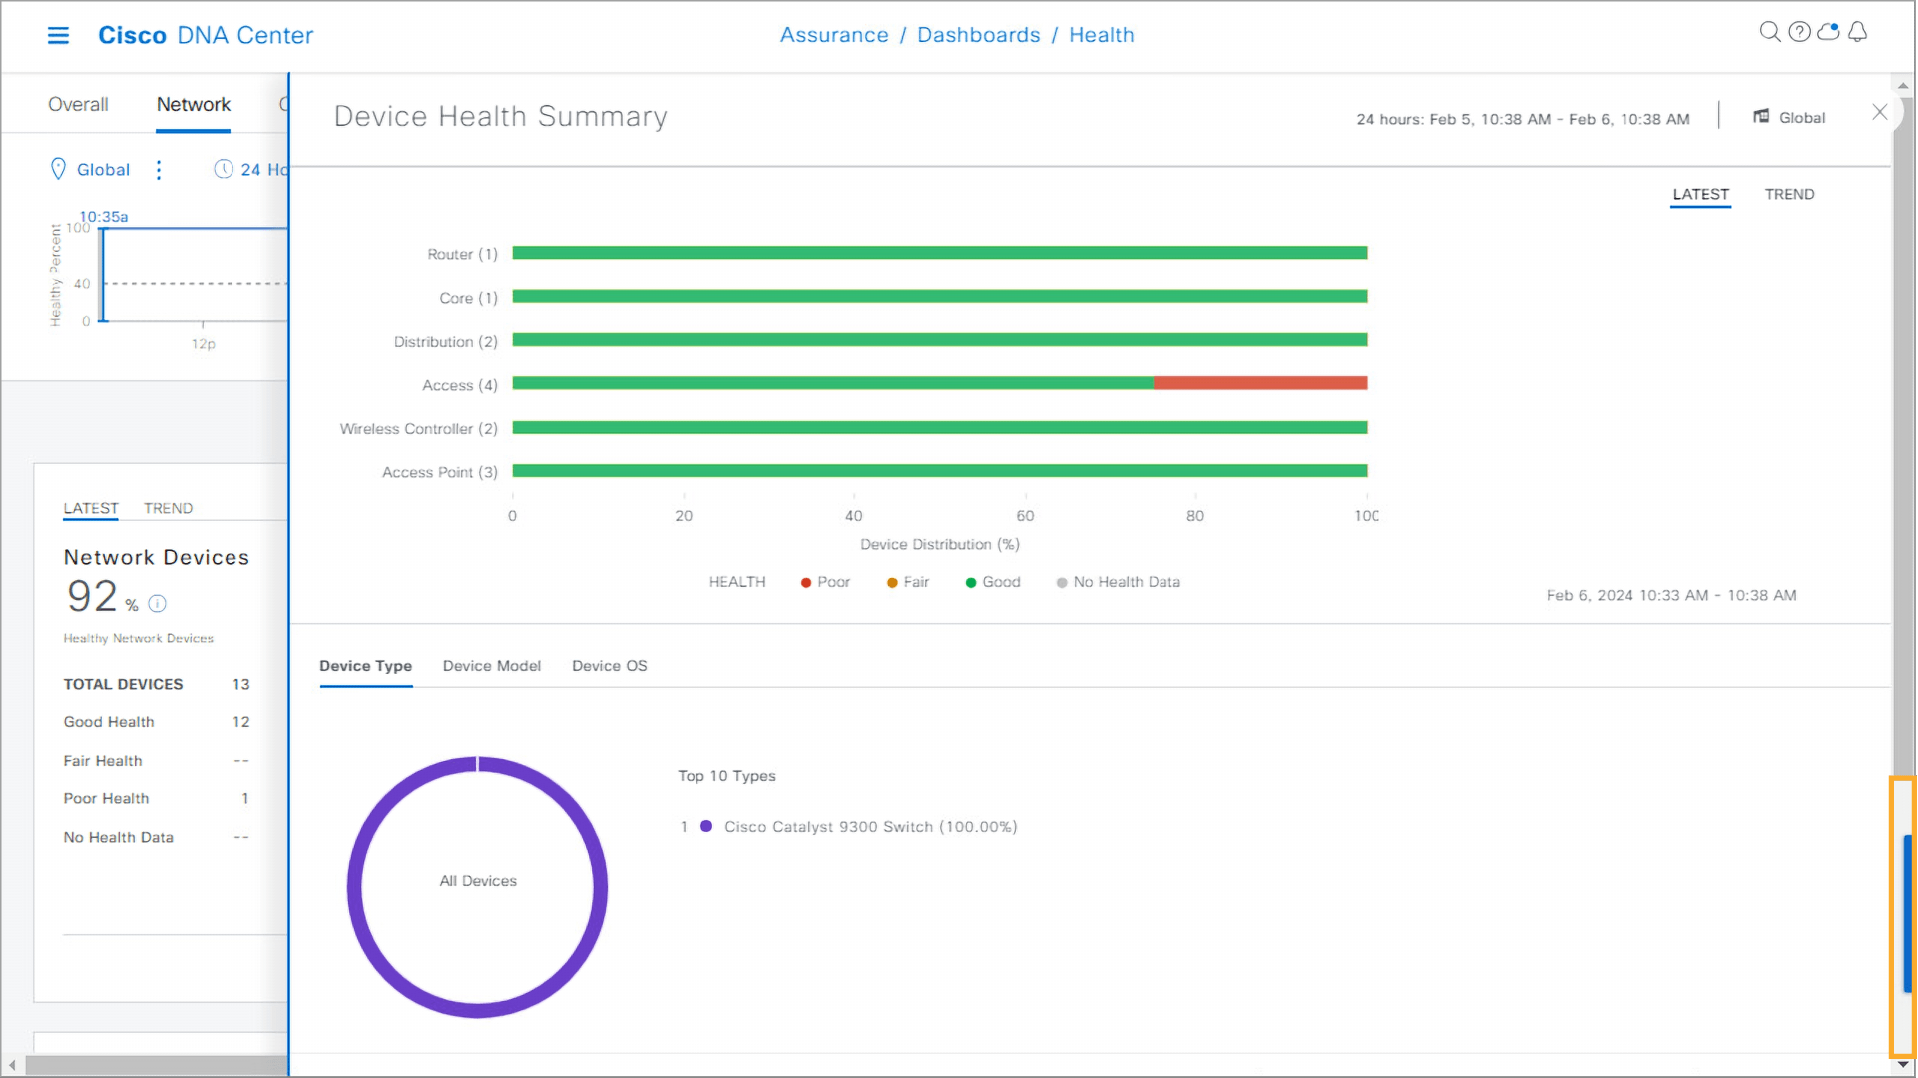
Step 10:
- Click View Details in the Network Devices health dashlet to view the Device Health Summary and locate the switch with poor health.
Note: To continue with Step 11, proceed to the next topic.
After identifying switches that may be contributing to network issues, a detailed analysis of these devices is necessary. This analysis involves examining specific health metrics and understanding the broader implications of their performance.
Step 11:
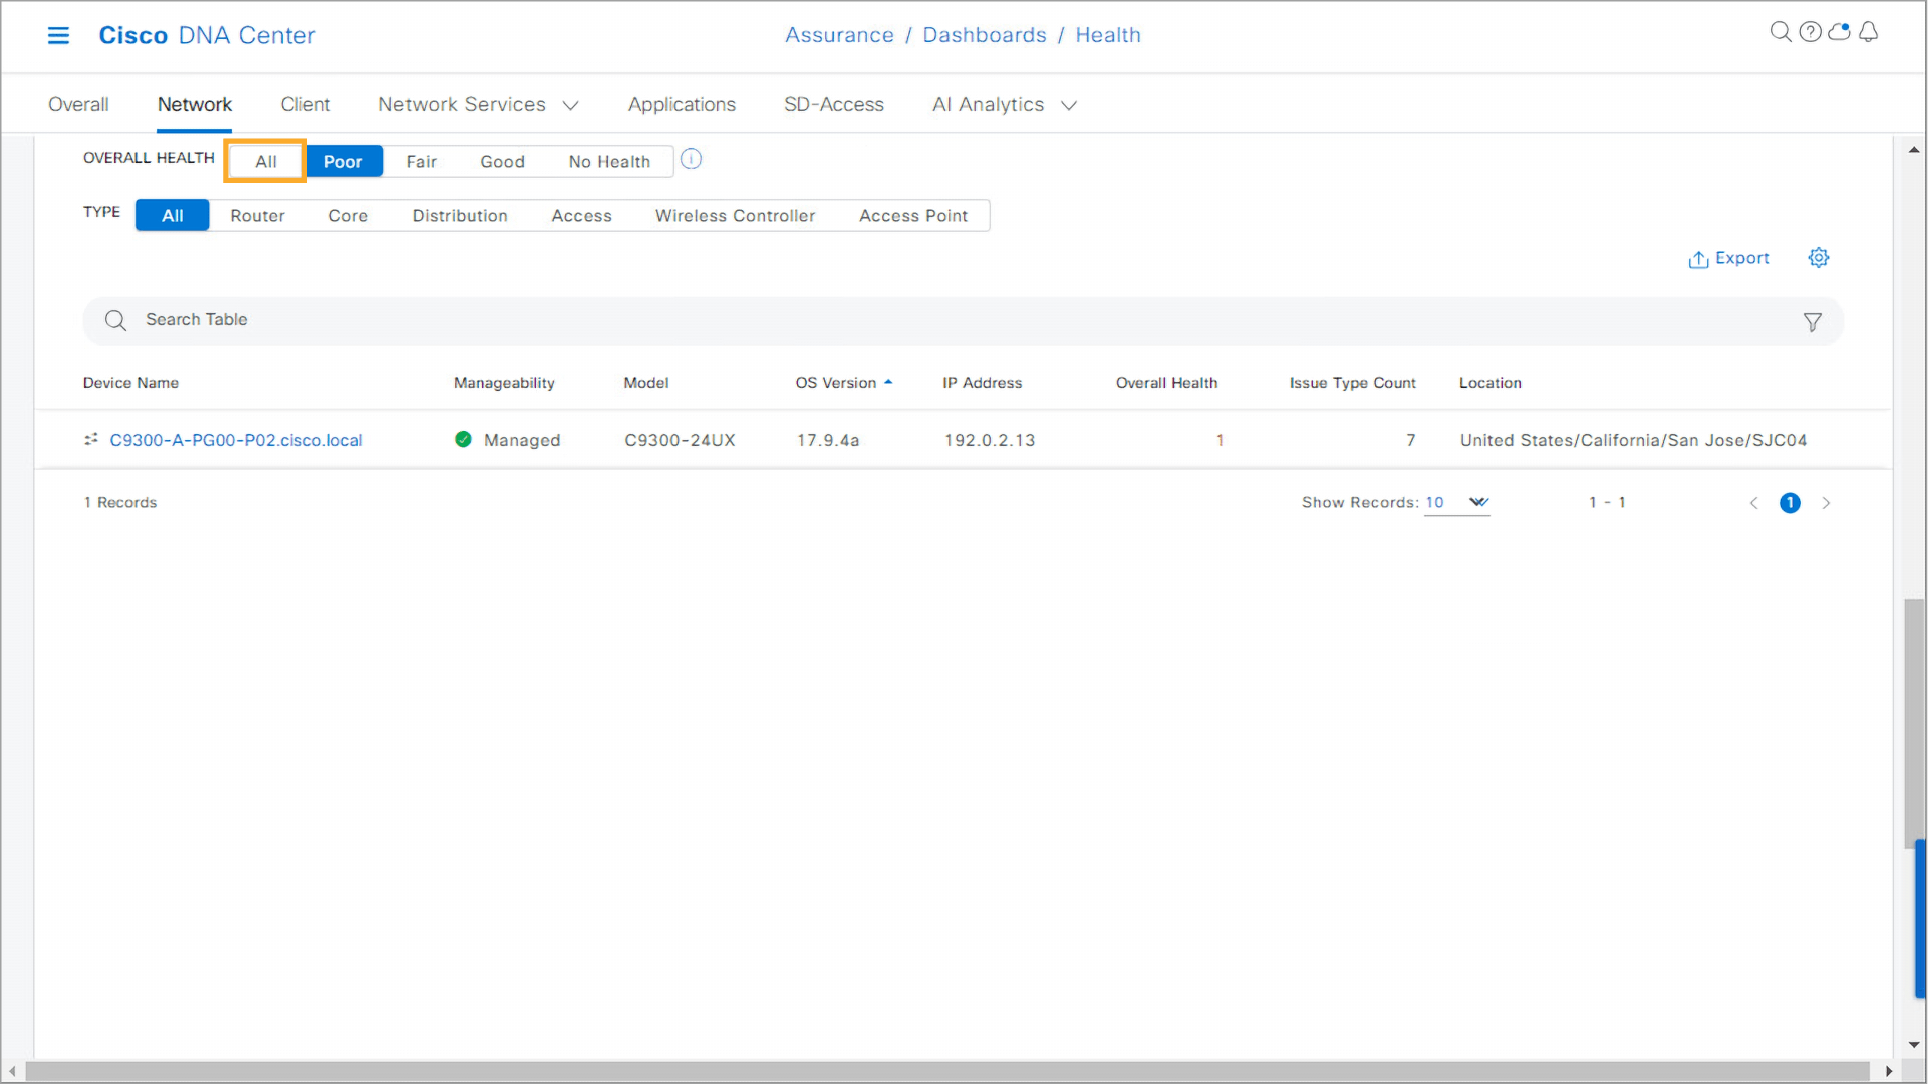
- The Device Health Summary allows you to list the device of a certain category with a certain health score. In the Access category, click the red area to display only access switches with poor health.
Step 12:
- Click the bottom part of the scroll bar on the right to scroll down to the bottom of the page. The scrolling functionality is not supported in this simulated environment. At the bottom, you can see the C9300-A access switch with the overall health score of 1, which indicates poor health of the device.
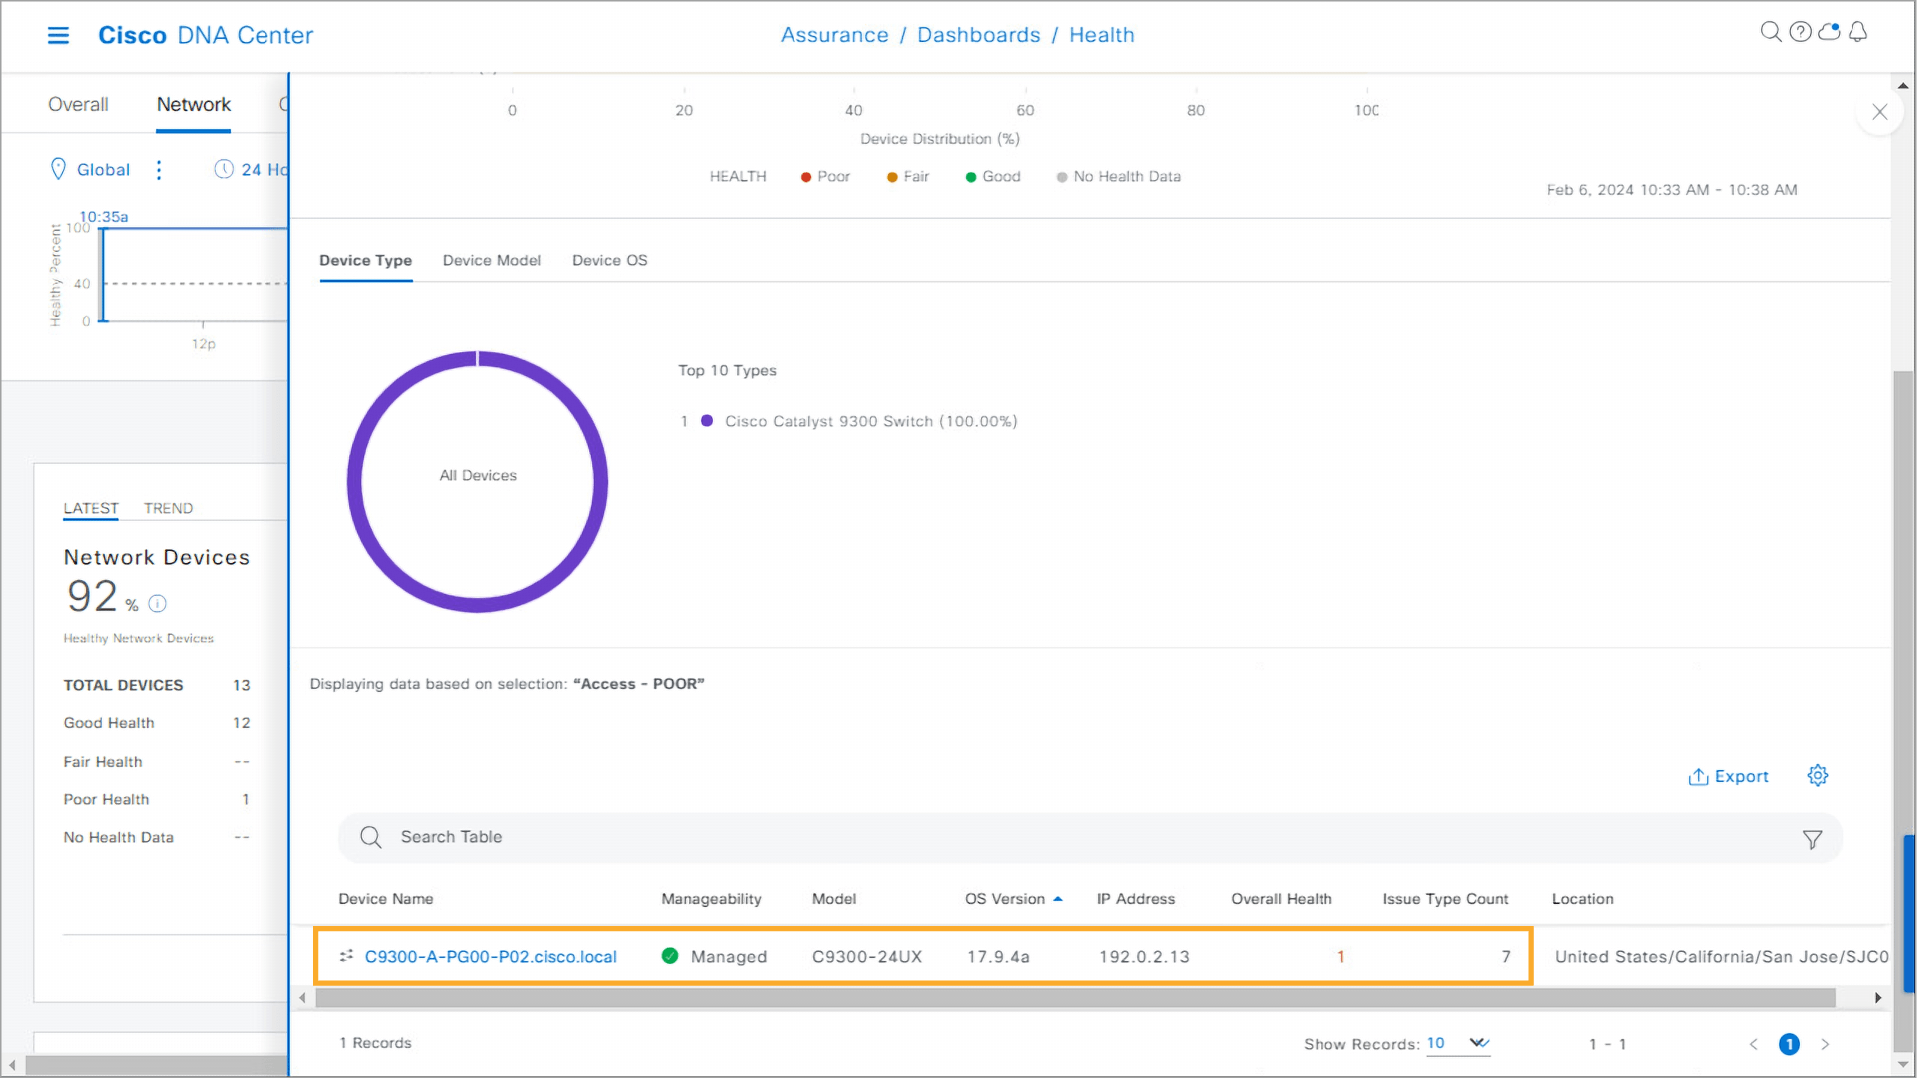
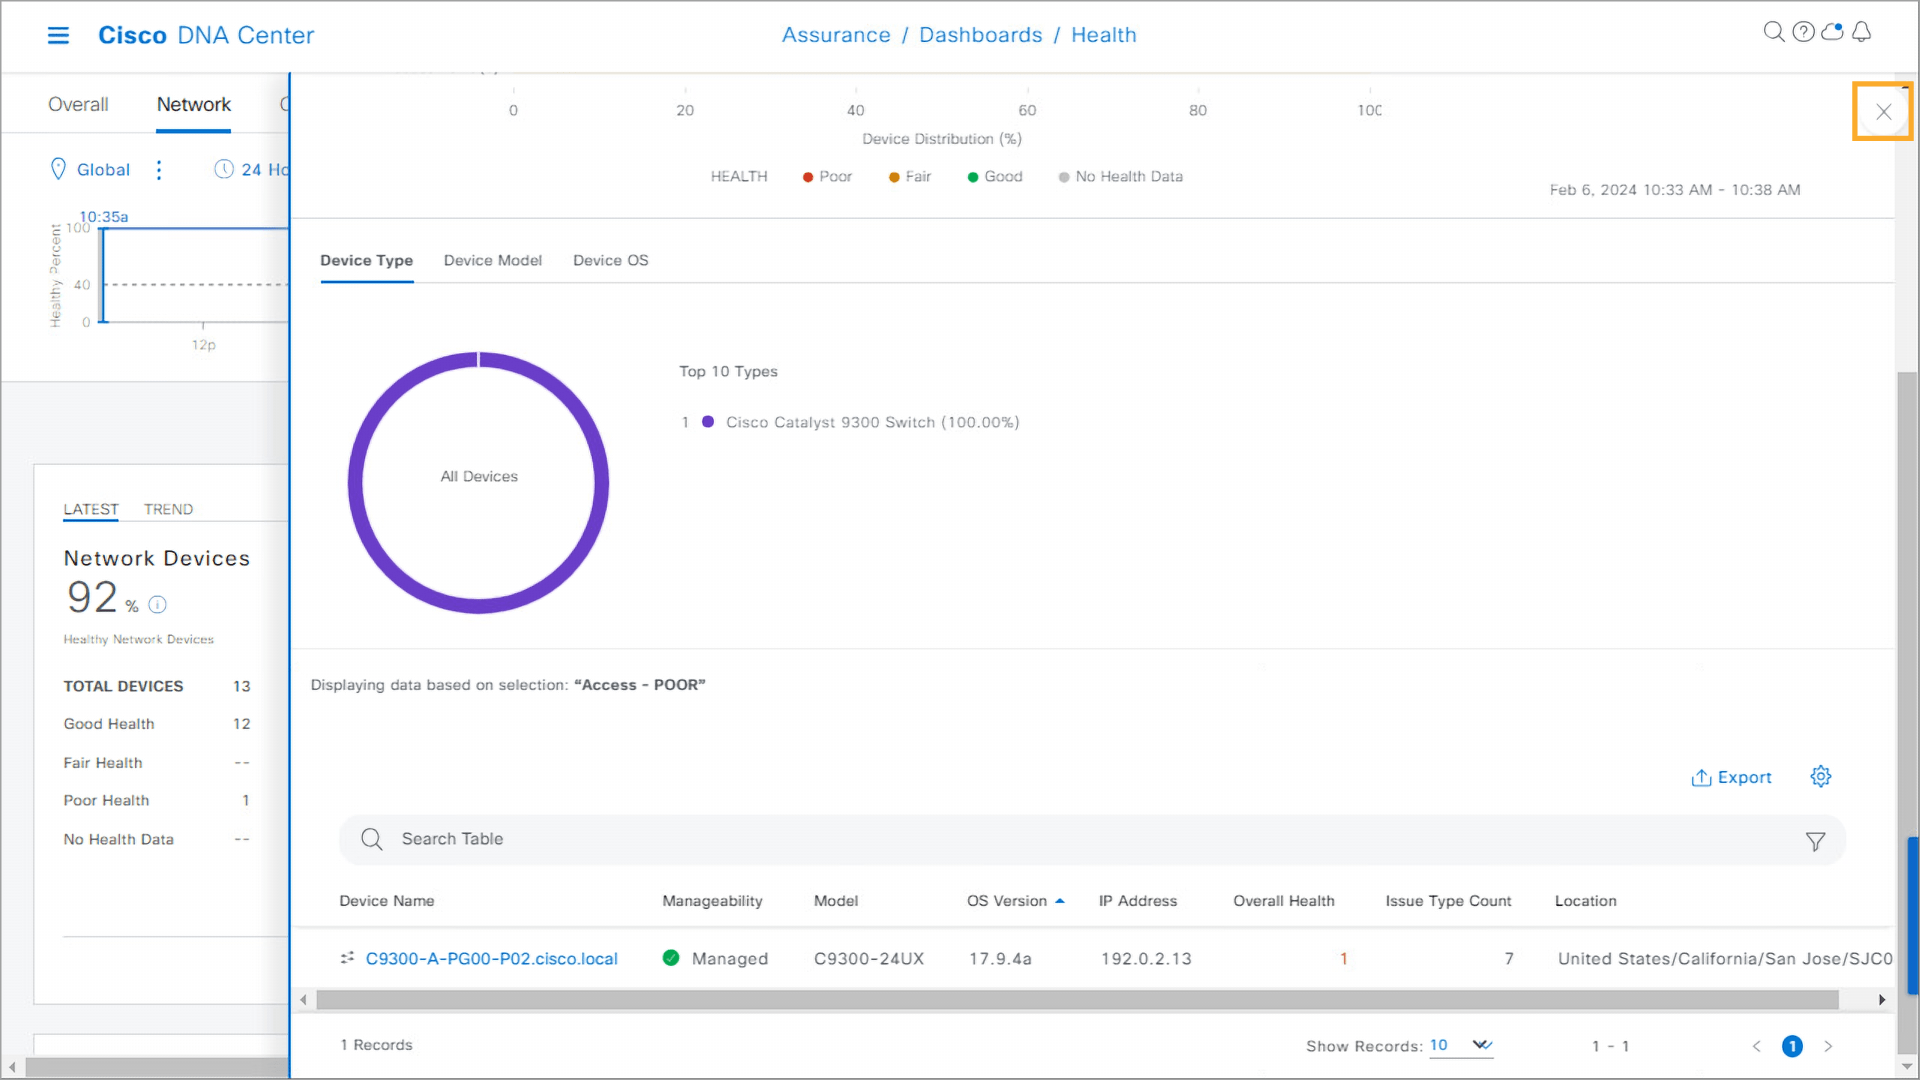
Step 13:
- In a real environment, you can navigate to the device 360 view directly from this screen by clicking the device name. However, you will navigate to the device 360 view from another screen. Close the details by clicking X in the upper-right corner of the window.
Step 14:
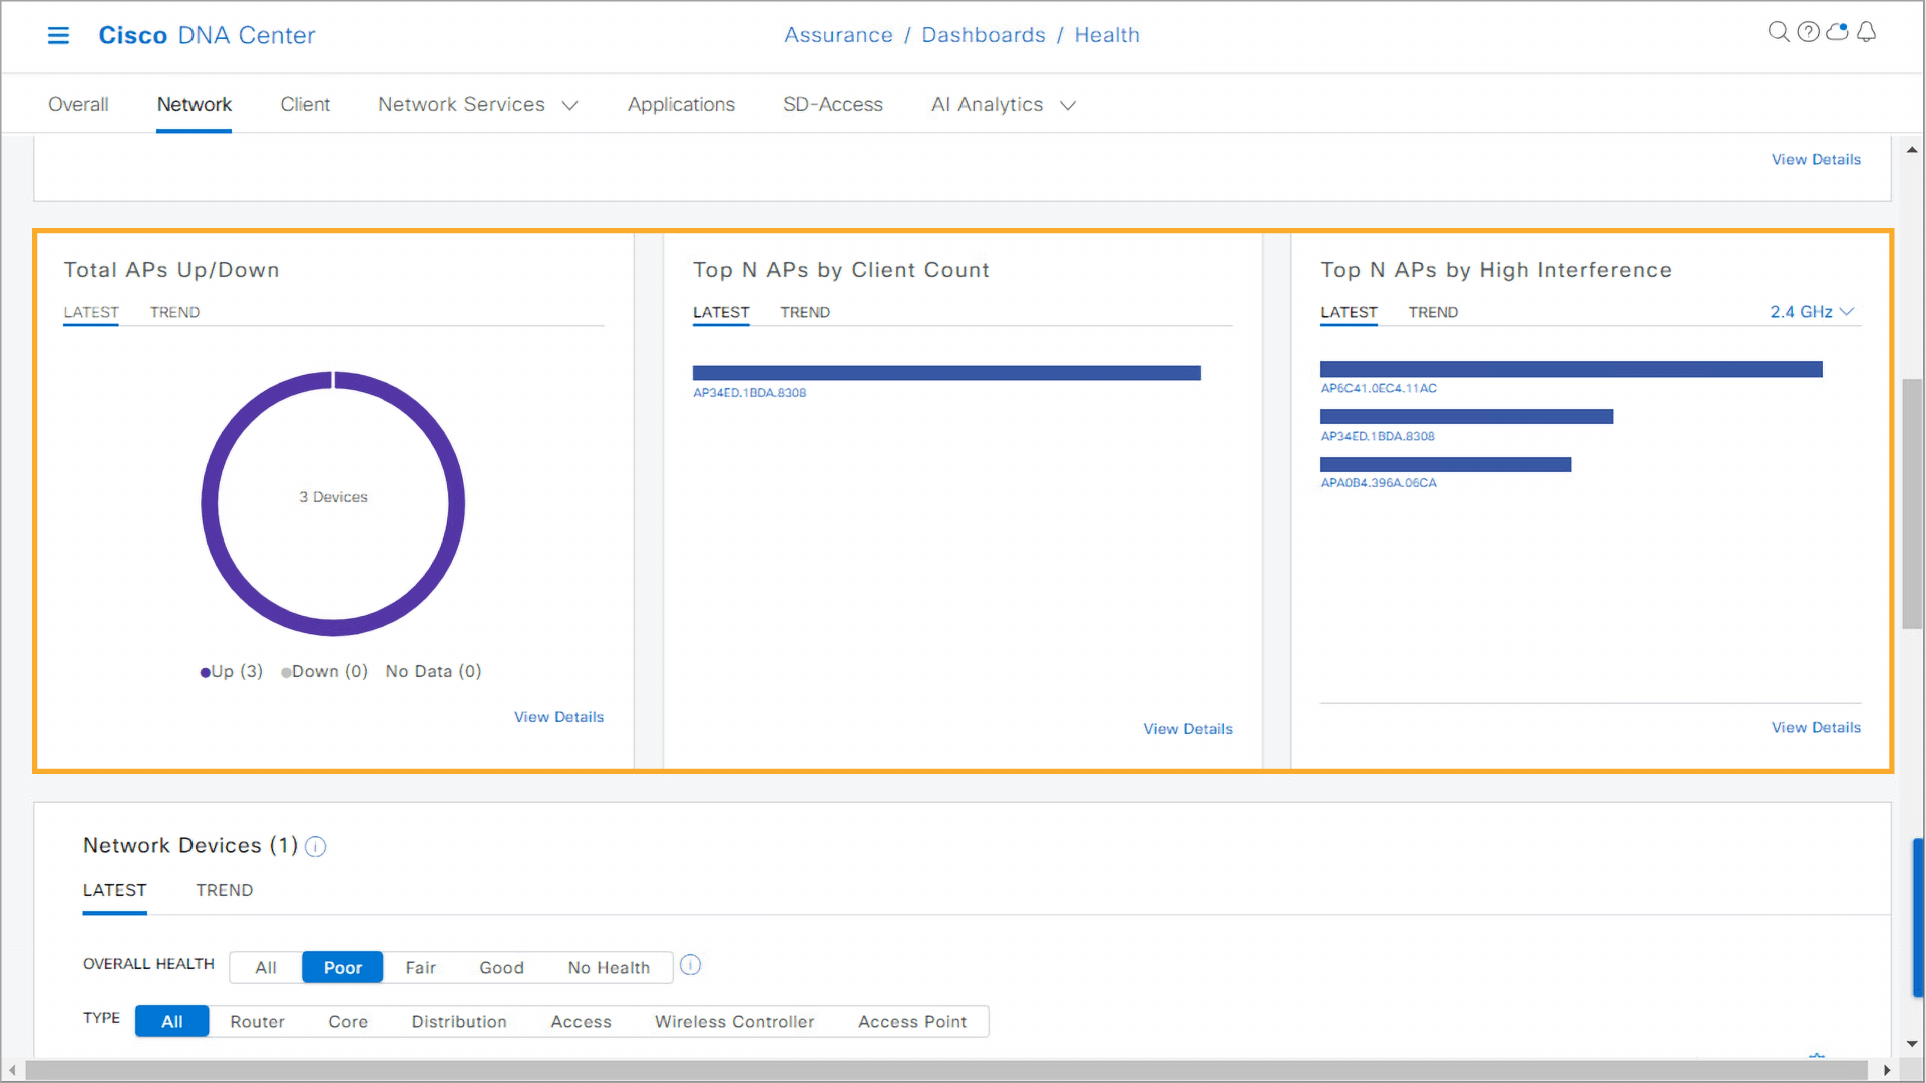
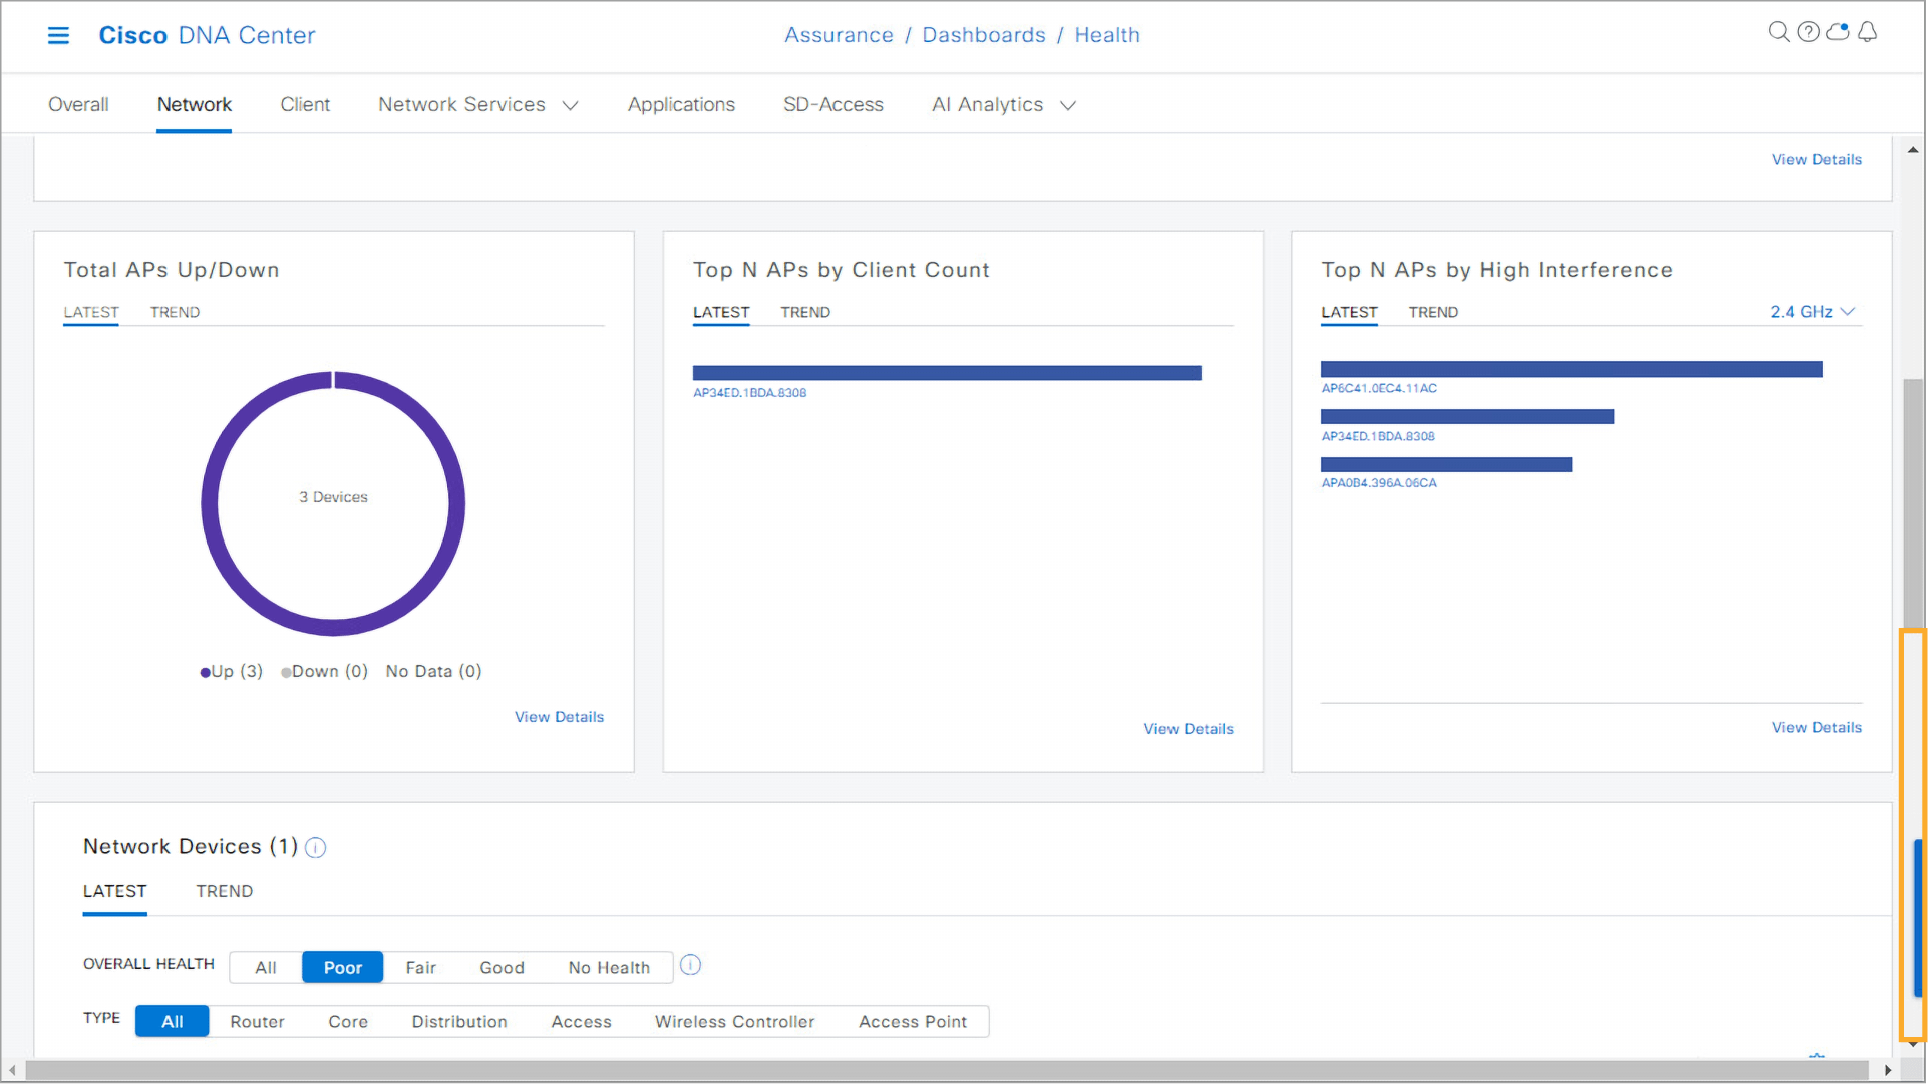
- Click the bottom part of the scroll bar to scroll down and view the wireless access point-related dashlets. The Total APs Up/Down dashlet displays access point connectivity status information.
- The Top N APs by Client Count dashlet displays the access points with the highest number of clients, and the Top N APs by High Interference dashlet lists the access points with high interference. However, these dashlets are not relevant for this activity.
Step 15:
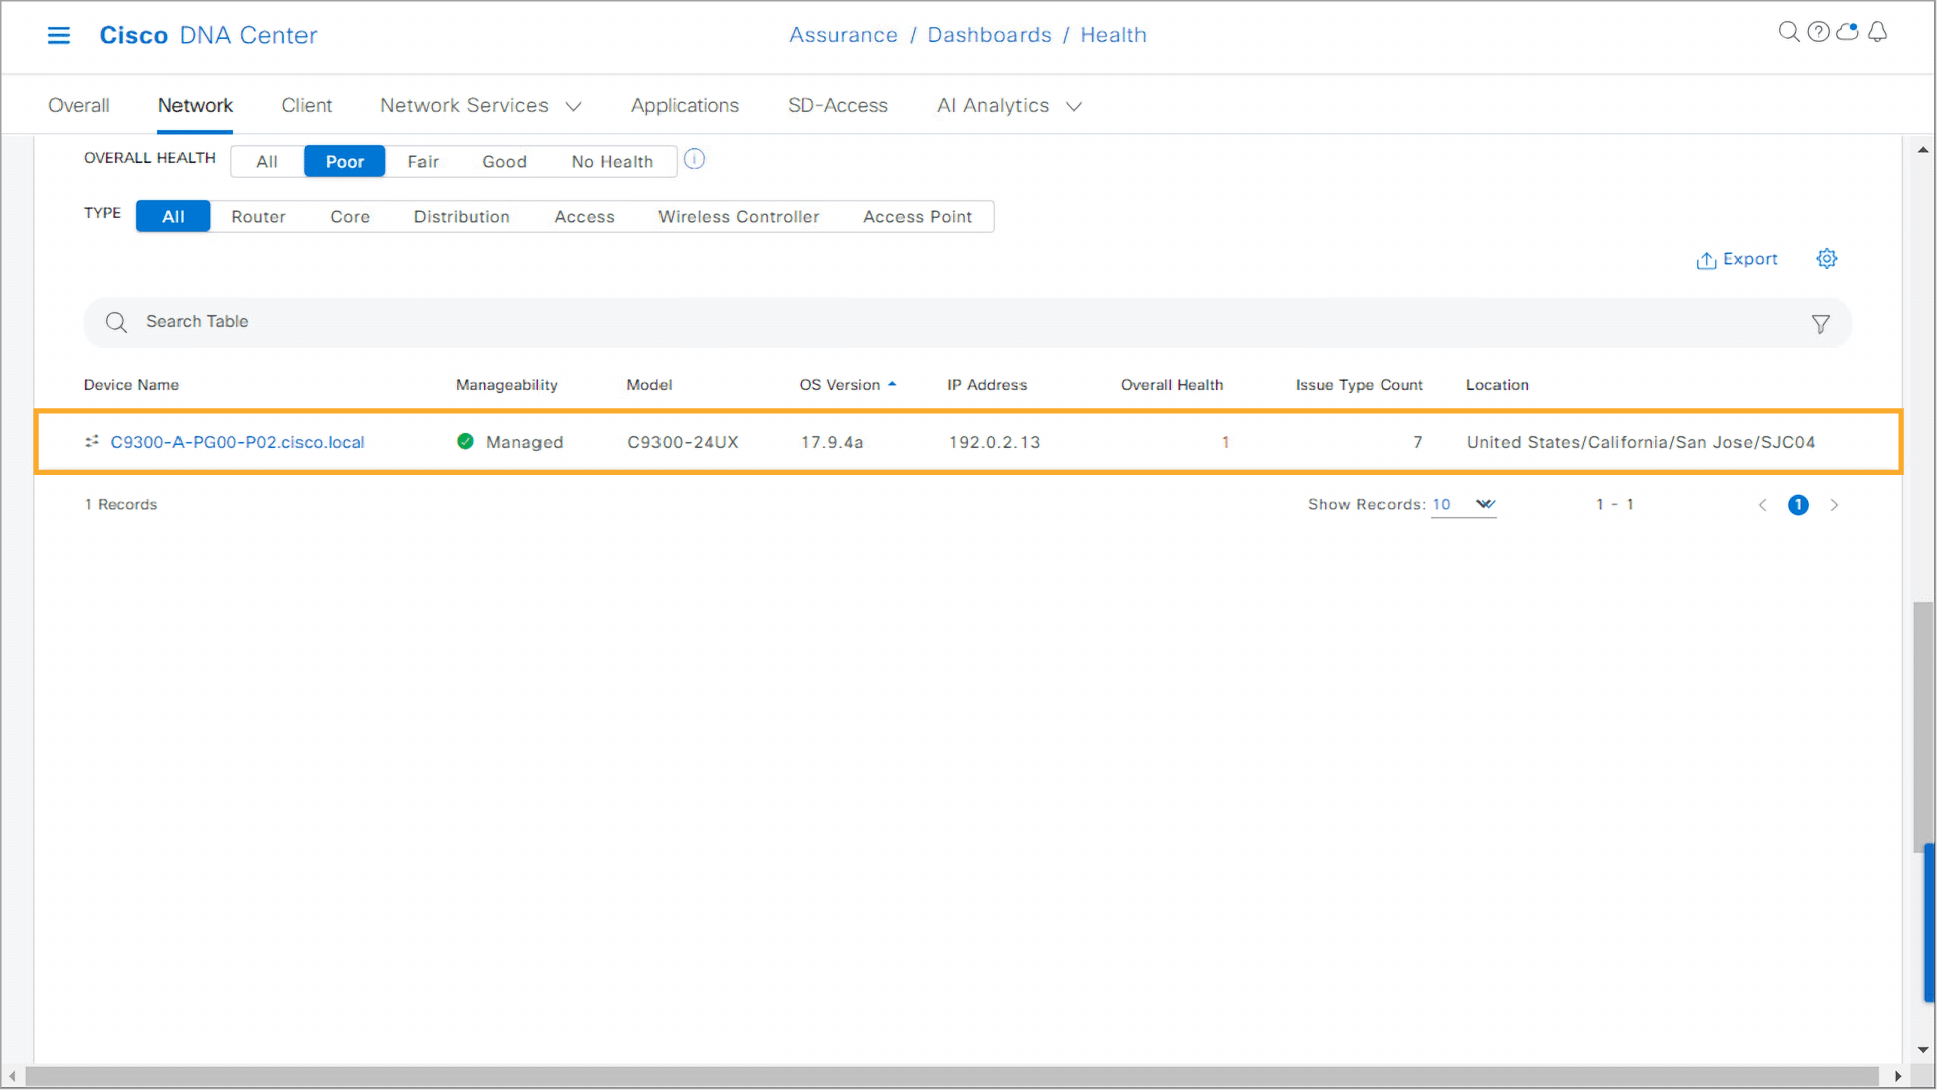
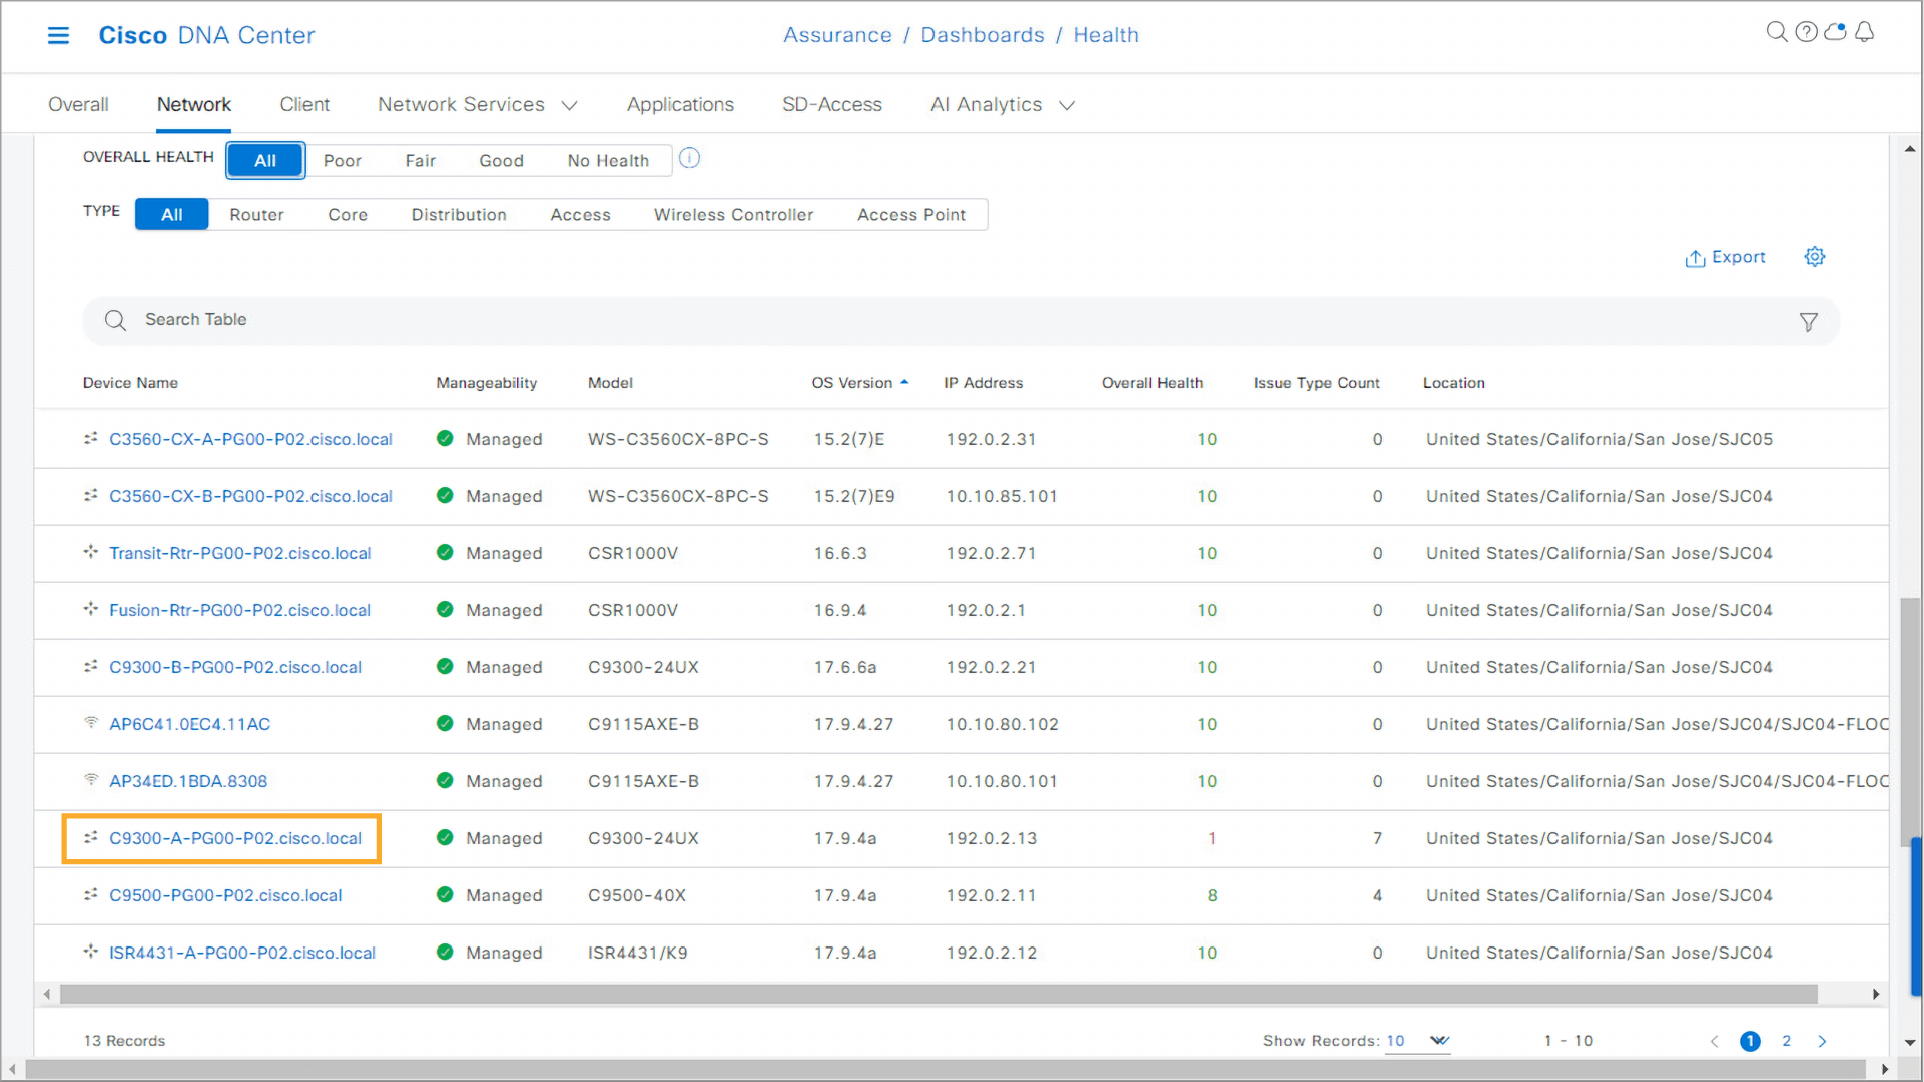
- Click the bottom part of the scroll bar to scroll down. The Network Devices dashlet lists all the devices in the network. You can use the filters to view the devices by overall health or device type.
- If there are any devices with poor health in the network, the filter by default is set to show only those devices.
- You again see the C9300-A access switch in the list along with some information, such as model, OS version, and location. The switch has poor health (health score of 1), resulting in reported client connectivity issues.
Step 16:
Display all devices inside the Network Devices dashlet to examine health scores of other devices. Perhaps there are some other devices also contributing to the reported client issues. Click All for overall health inside the dashlet filter to display all devices inside the network, regardless of their health.
You can see that almost all other devices have good health with a score of 10 and no detected issues. The only exception is the C9500 core switch, which has good health with a score of 8 but with some detected issues.
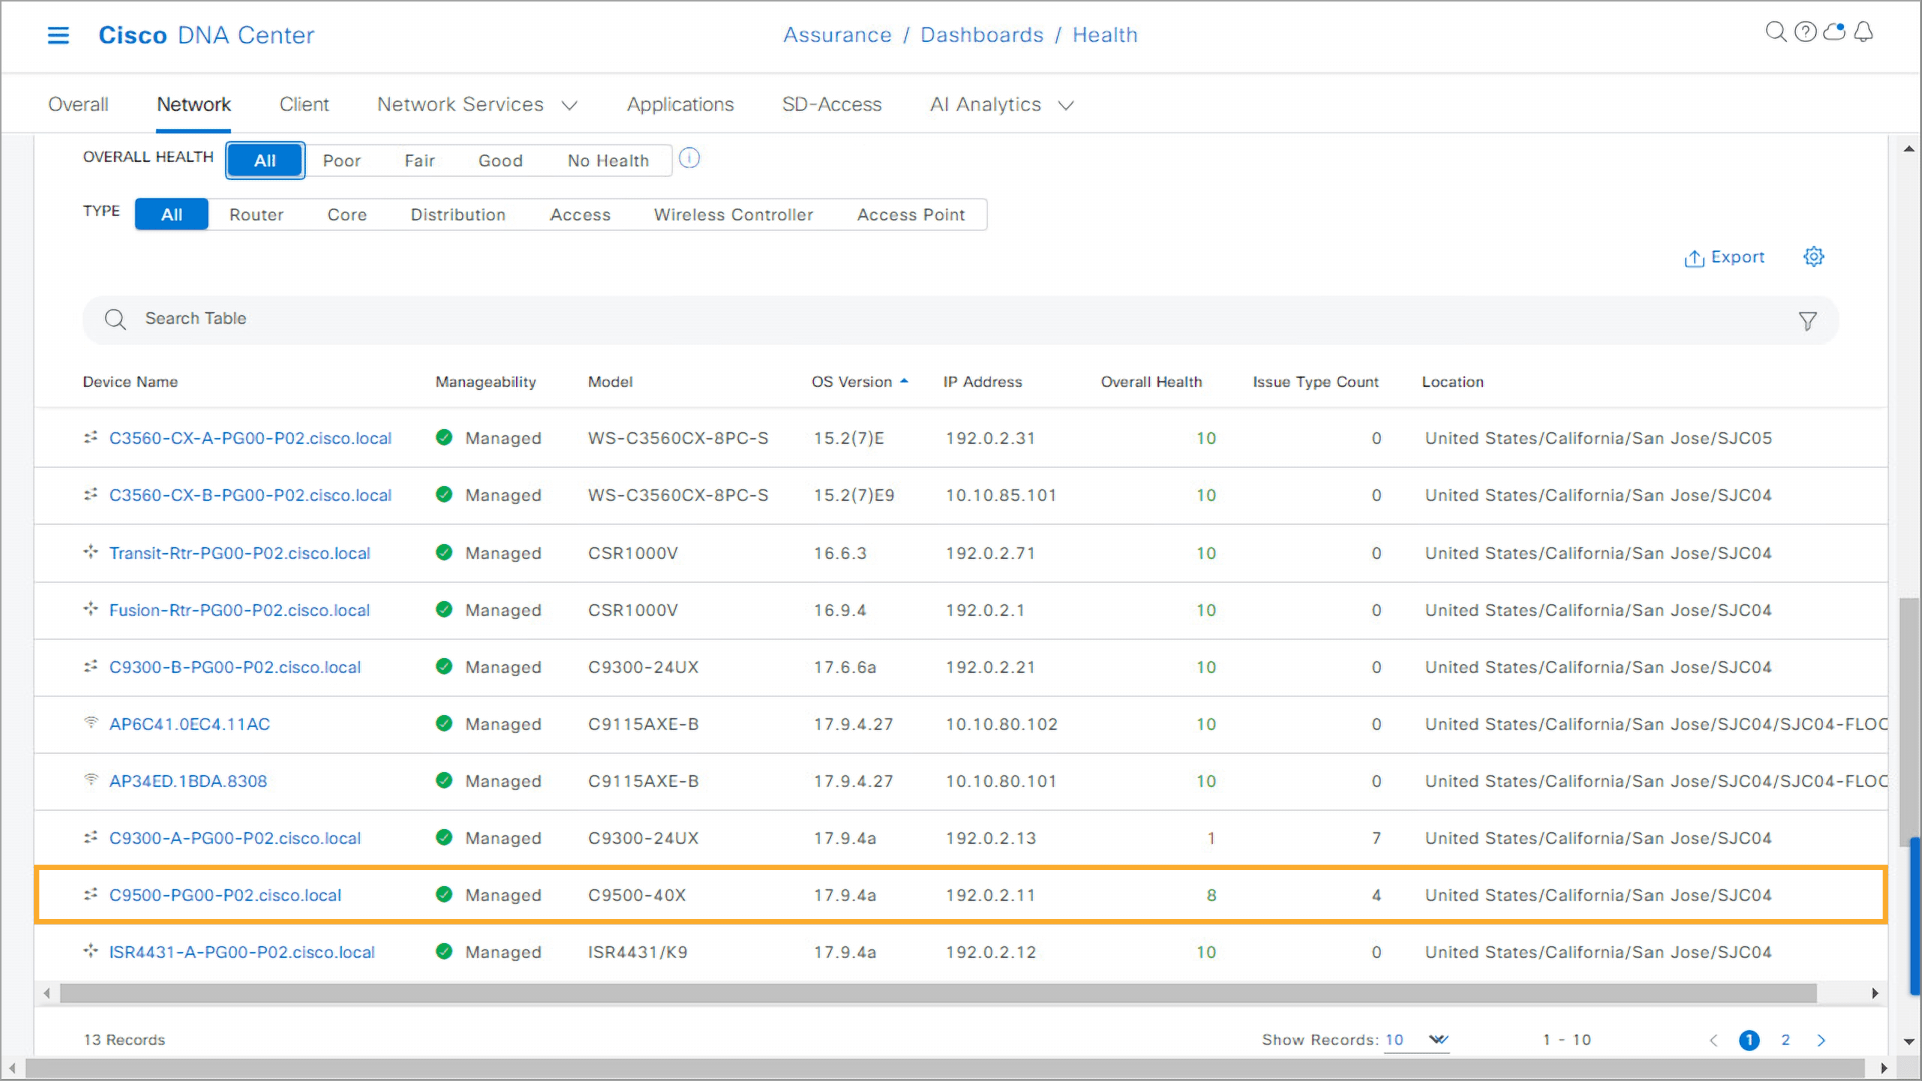
In the next task, you will examine if the poor health of the access switch and health of the core switch are correlated.
Note: To continue with Step 17, proceed to the next topic.
In the previous steps, you detected that the likely cause of the connectivity problems stems from the access switch with poor health. In this task, you will examine the details of that switch by looking at the device 360 view.
Step 17:
- From the Network Devices dashlet, click the C9300-A link inside the Network Devices list. The device 360 view opens.
Step 18:
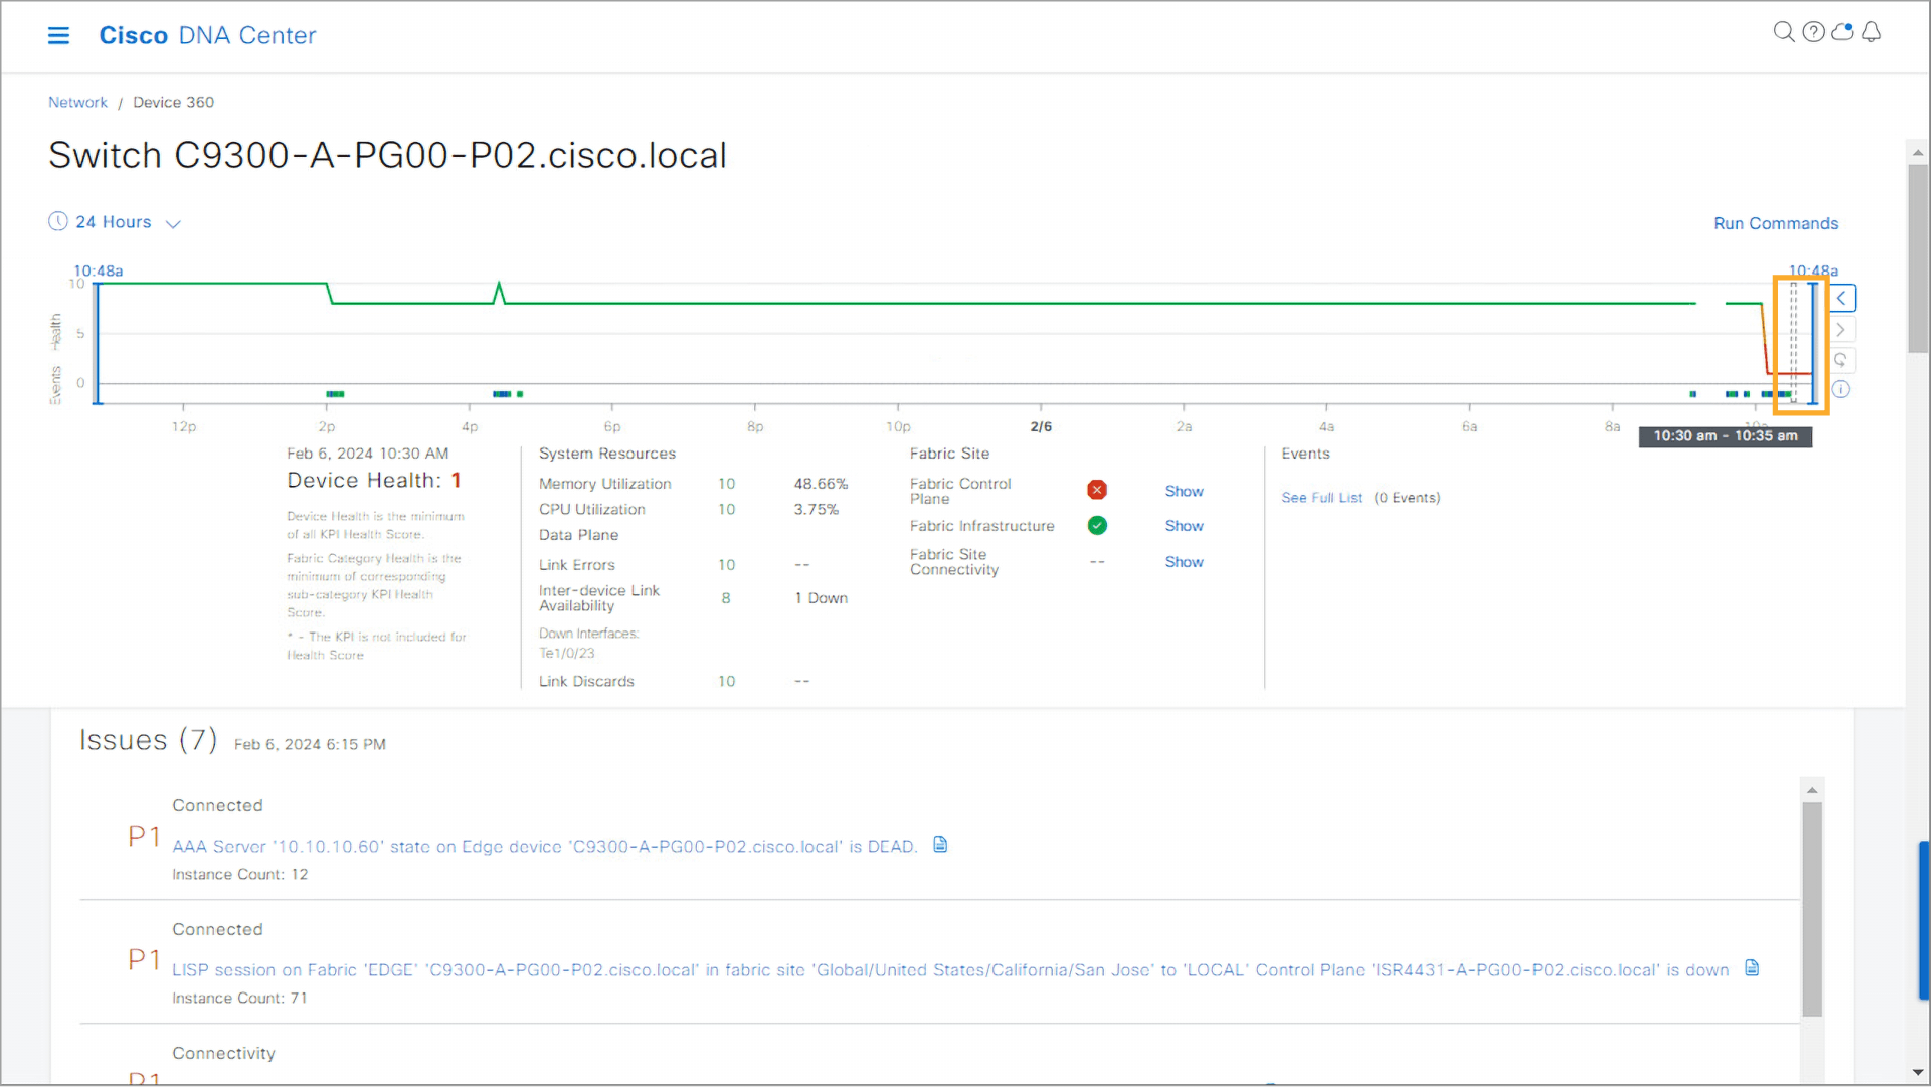
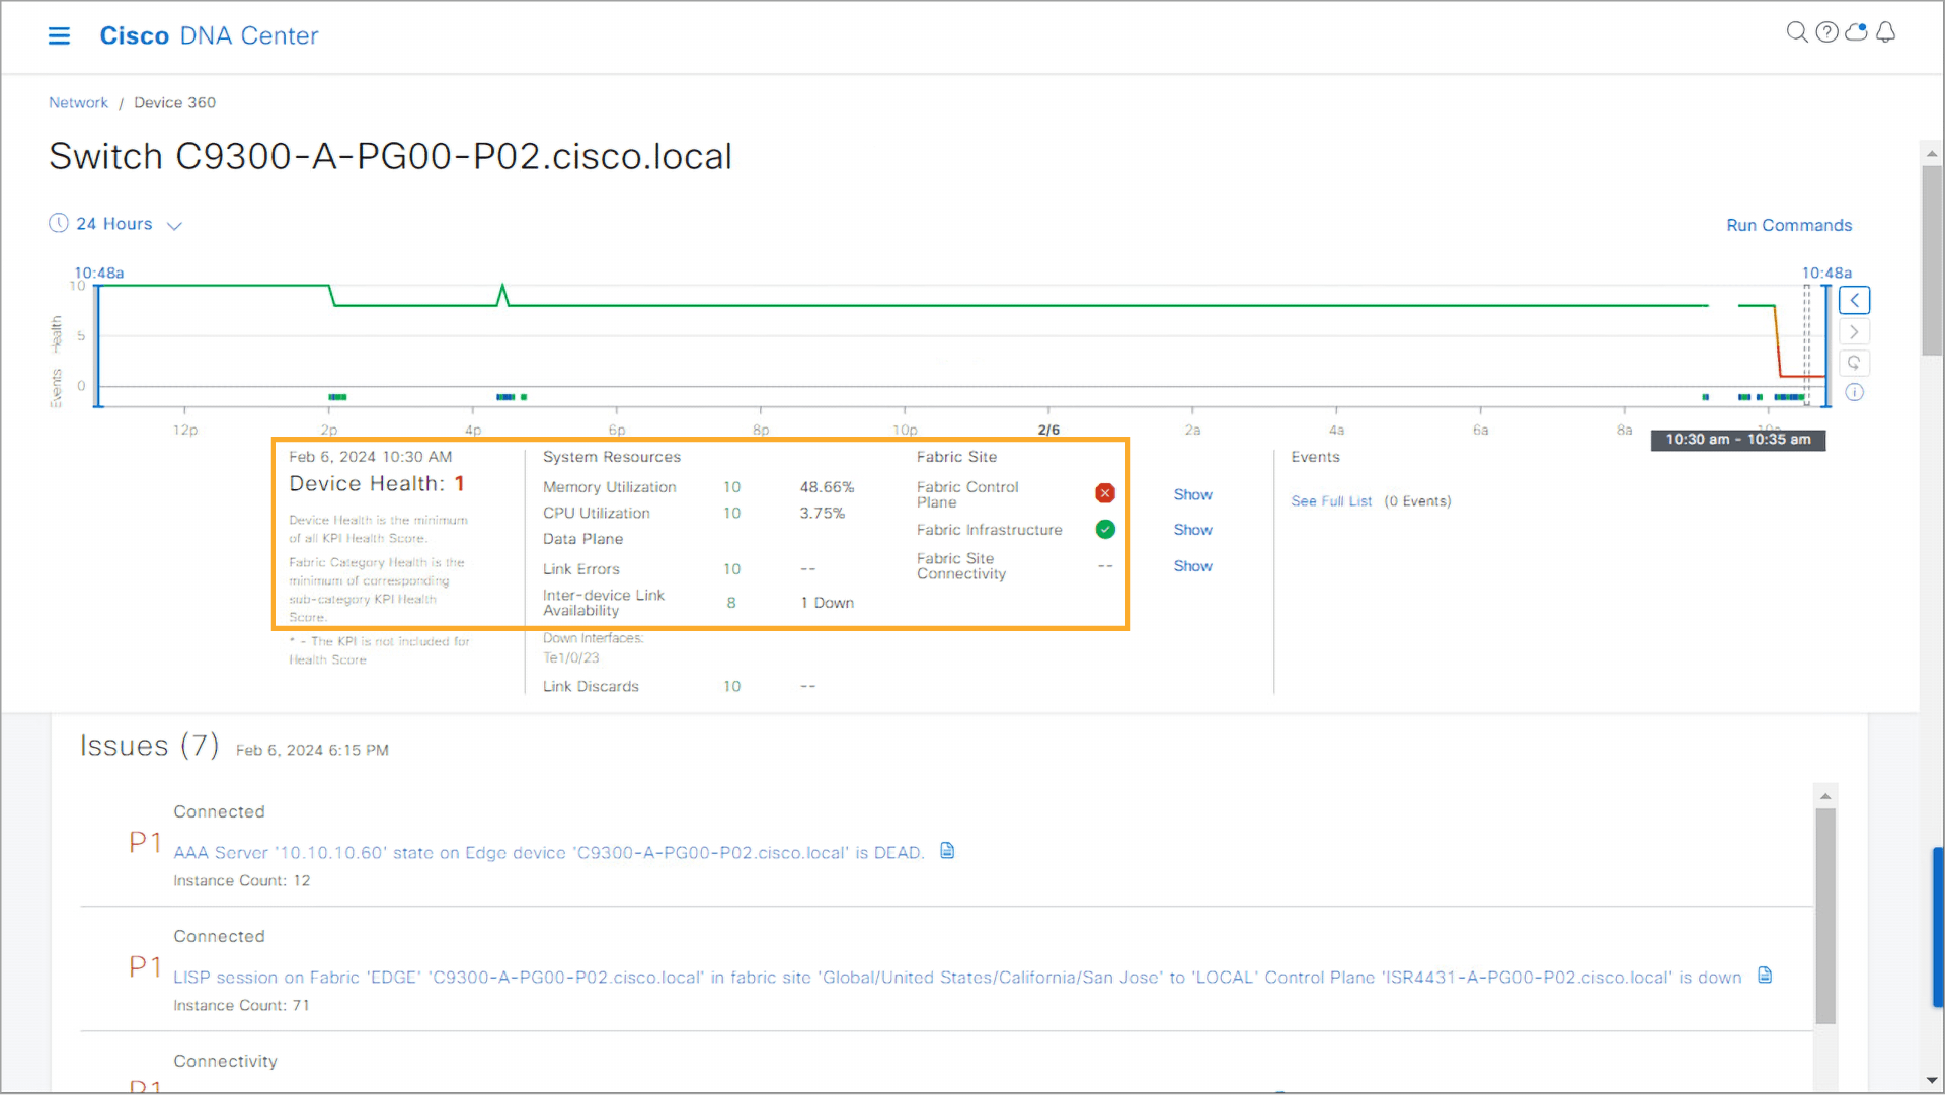
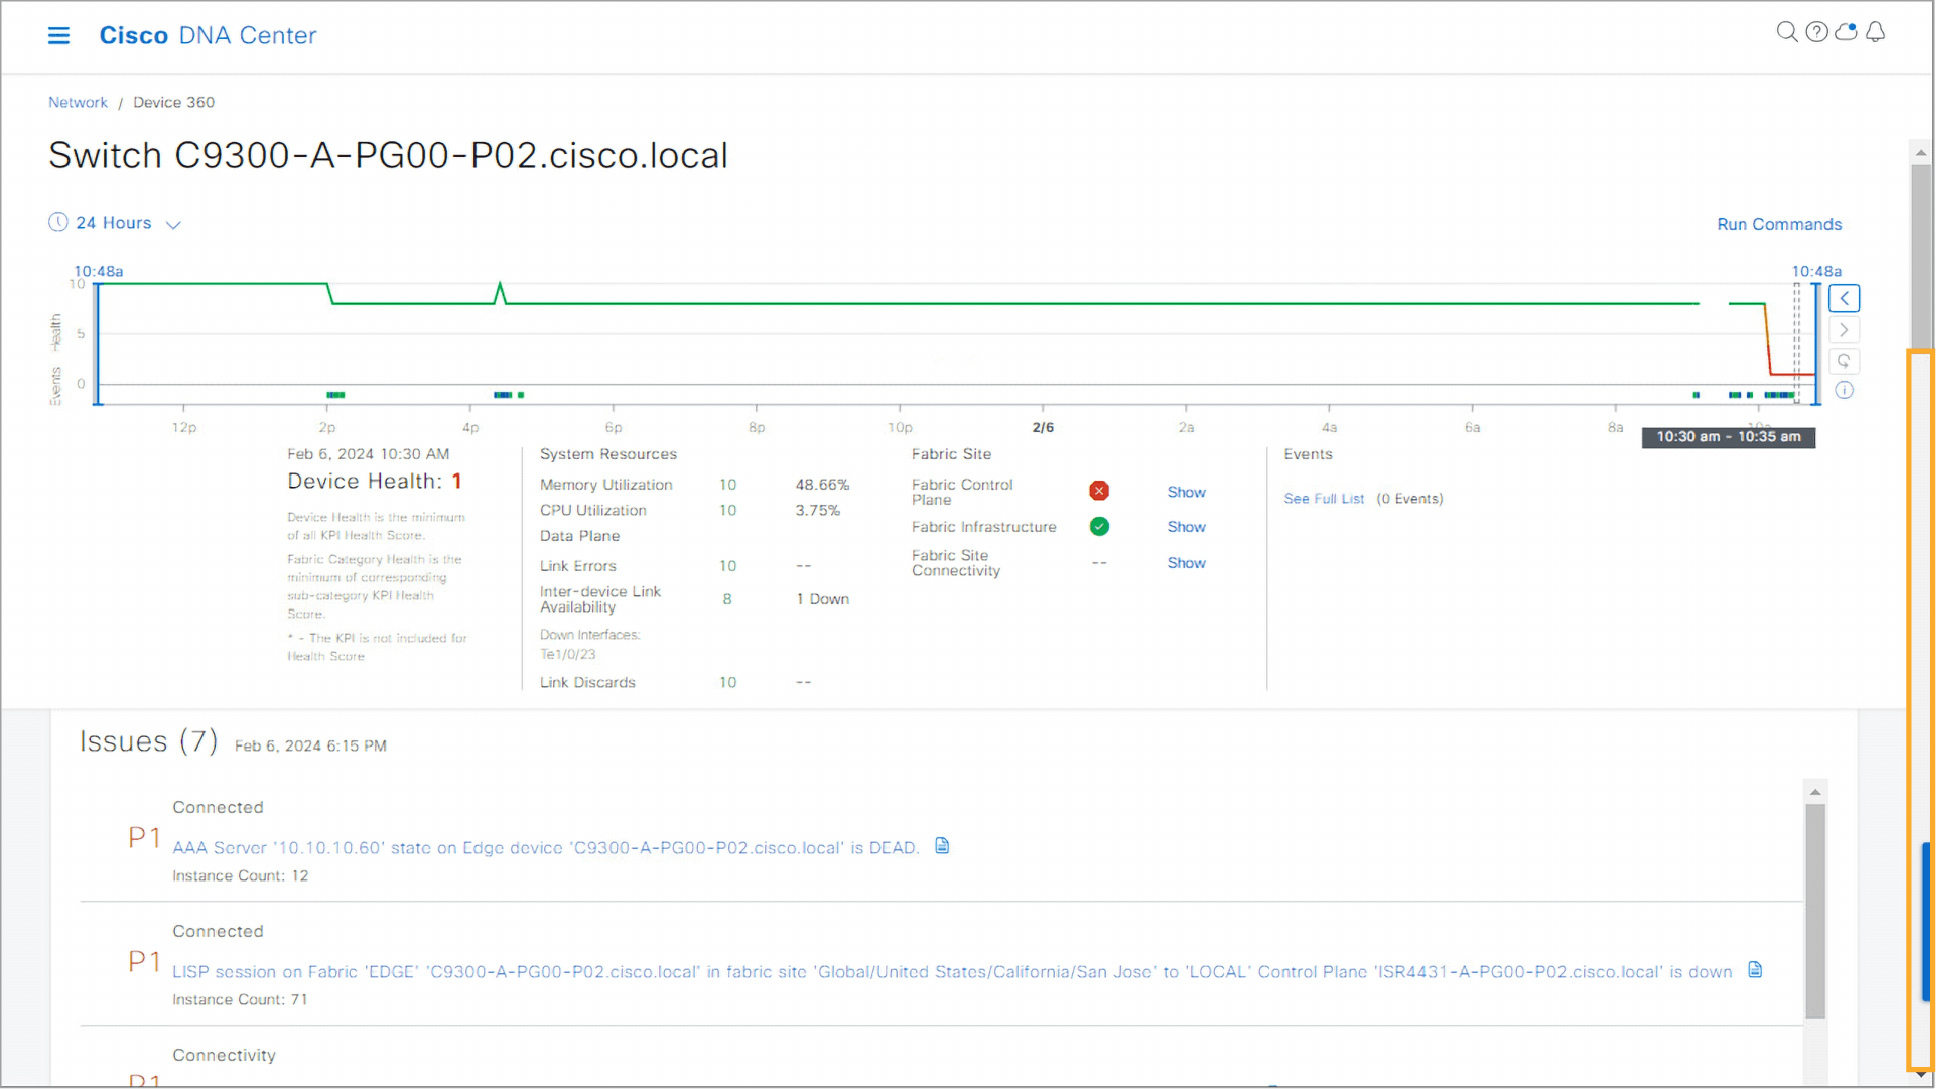
- Examine the Device 360 page, which allows you to monitor and troubleshoot a chosen device. First, focus on the health timeline dashlet that displays the health of the device for the chosen time interval. By default, the time interval is set to the last 24 hours. Click the right side of the timeline where the health line drops and changes color from green to red.
Step 19:
- Observe the device health details. You can see that the health of the device at the chosen time is 1.
- Factors that contribute to poor health are interdevice link availability and no reachability to the fabric control plane device.
Note: To continue with Step 20, proceed to the next topic.
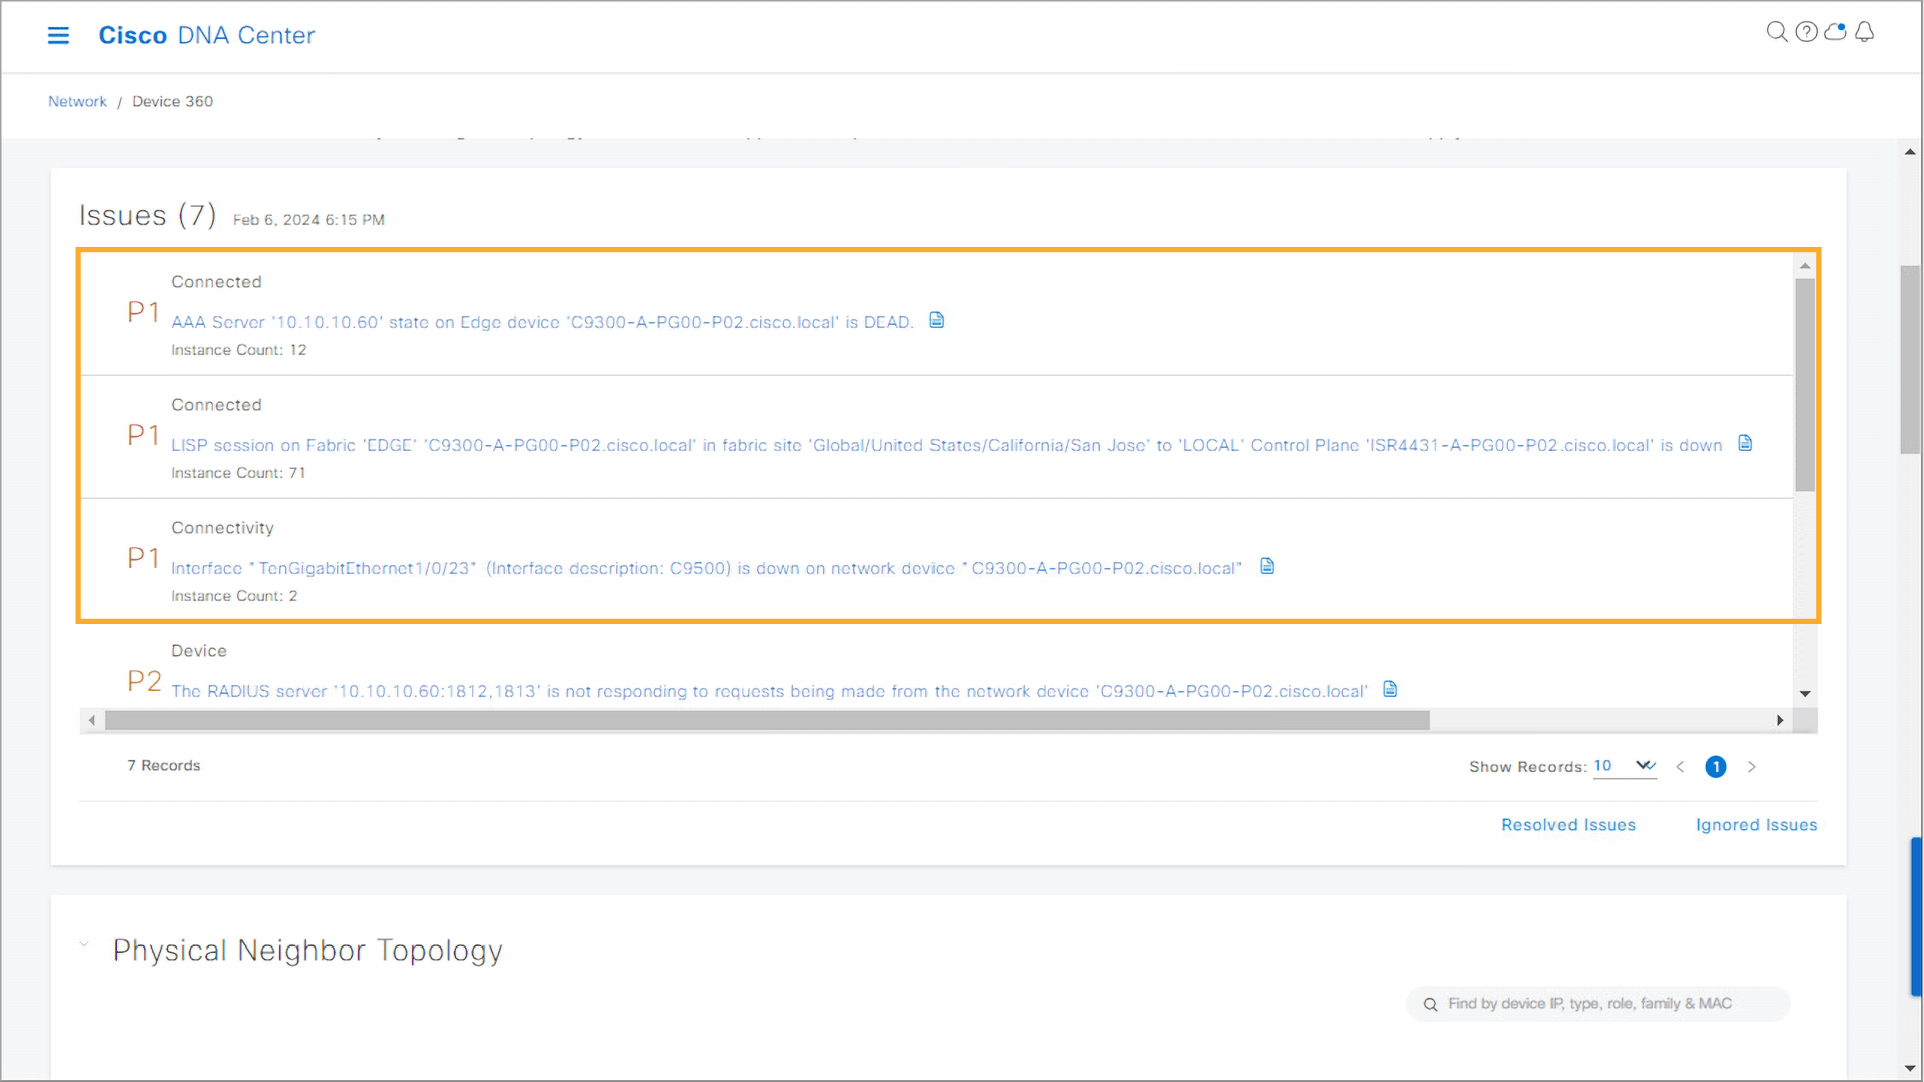
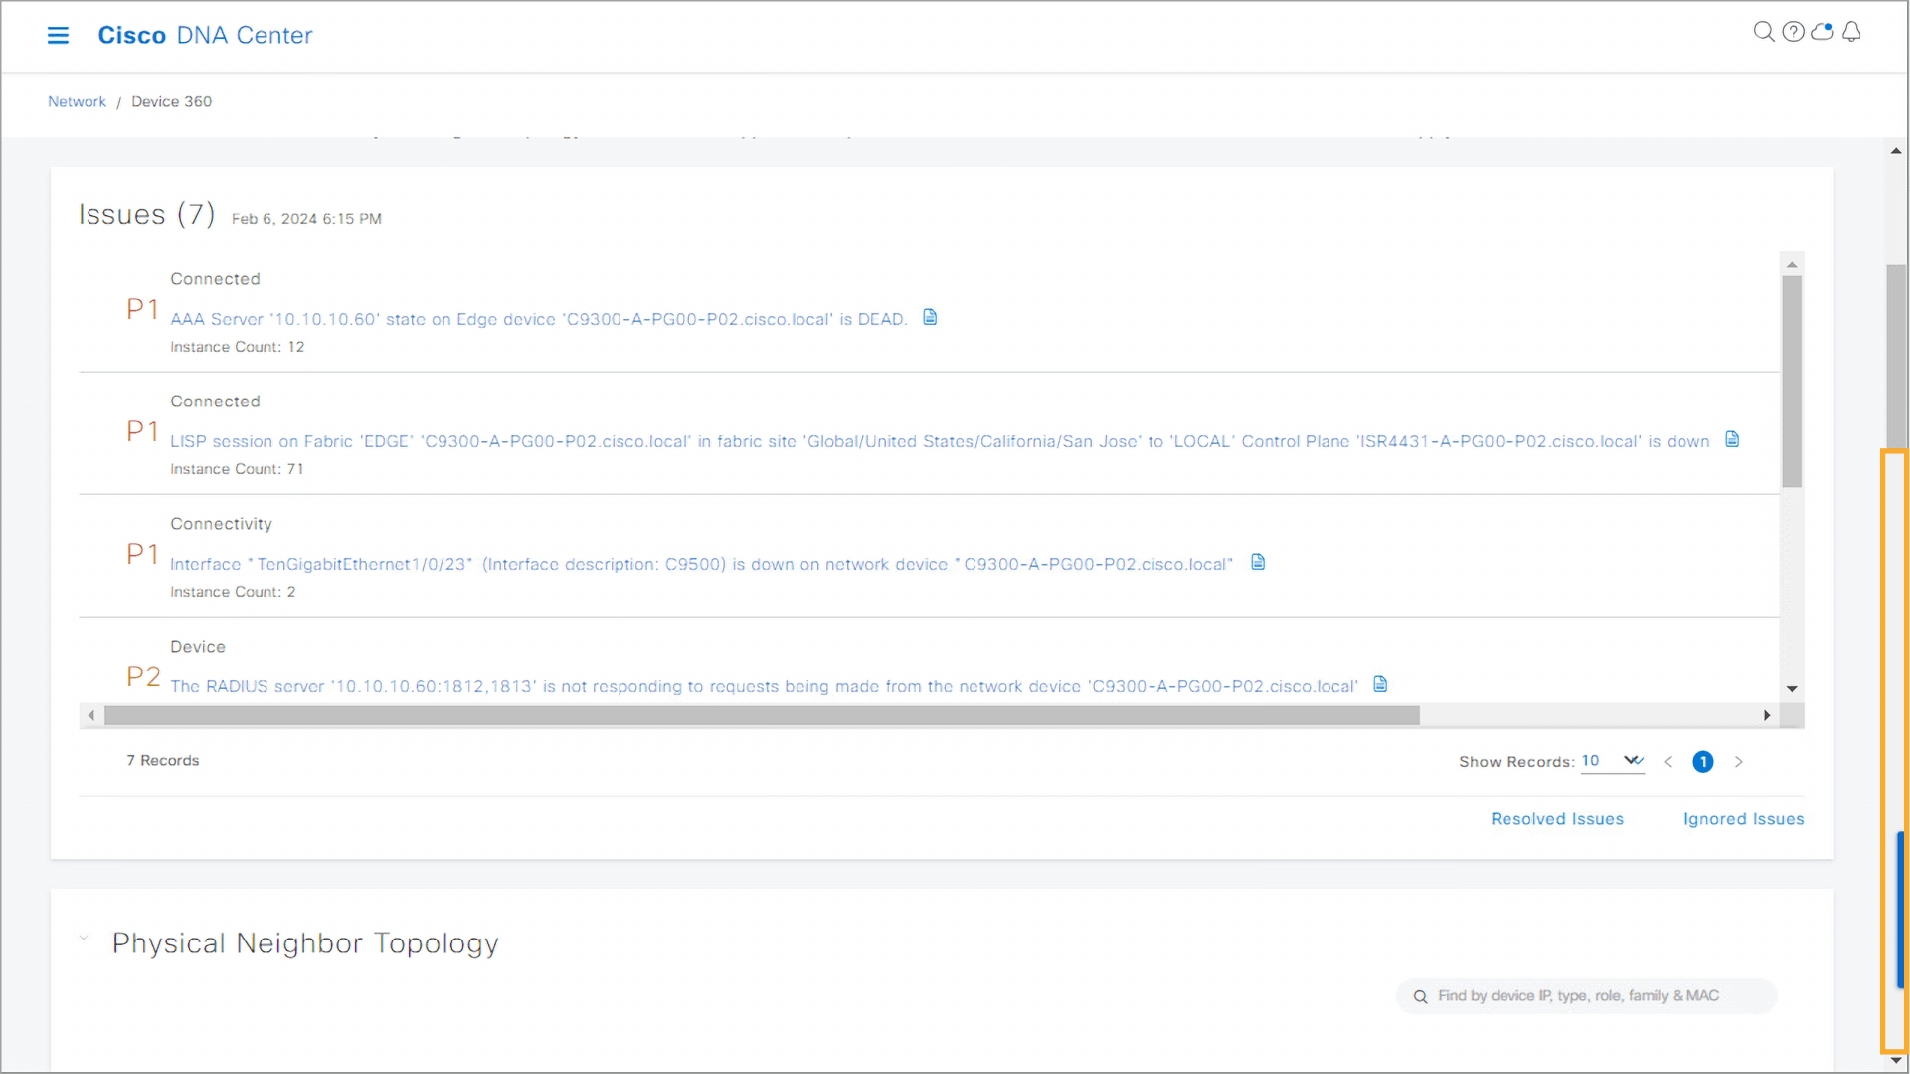
Step 20:
Click the bottom part of the scroll bar once to scroll down the page and examine the issues. The Issues dashlet displays issues that are detected for the chosen device. The issues are listed with a priority number and a description of the issue.
Notice that there are many issues with priority 1 detected on the device. Based on a quick look at the issues, you could tell that several issues occurred because the interface TenGigabitEthernet 1/0/23 went down. These issues include Open Shortest Path First (OSPF) adjacency, Locator/ID Separation Protocol (LISP) session, and AAA connectivity issues.
Note: In a real environment, you could start investigating the issues directly from this screen by clicking an issue name. During this simulated activity, you will investigate issues from another screen.
Step 21:
Click the bottom of the scroll bar again to scroll down the page and examine the topology.
The Physical Neighbor Topology dashlet shows the neighbors that are directly connected to the switch. Each icon shows a health score for the device, and each link indicates the interface status. You can see that one link between the devices is down, as indicated by the red color of the link.
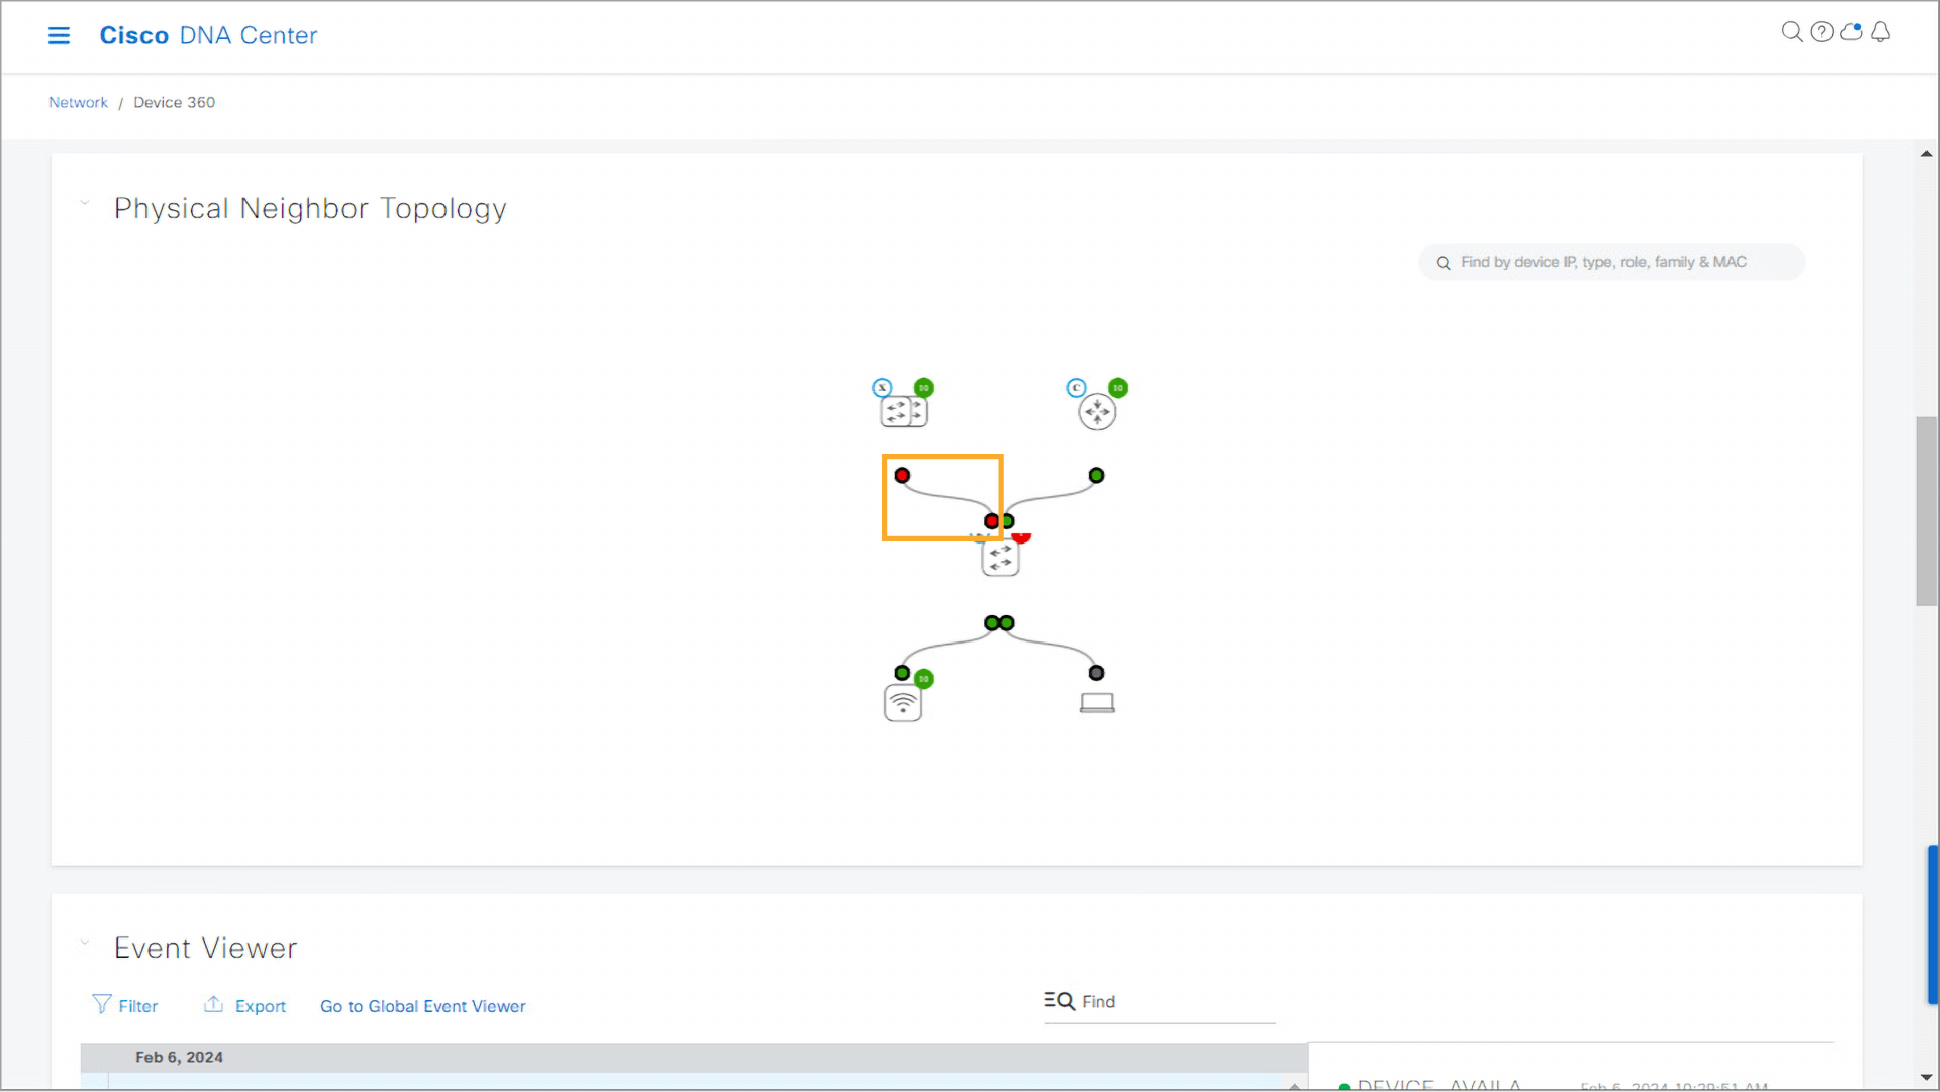
Step 22:
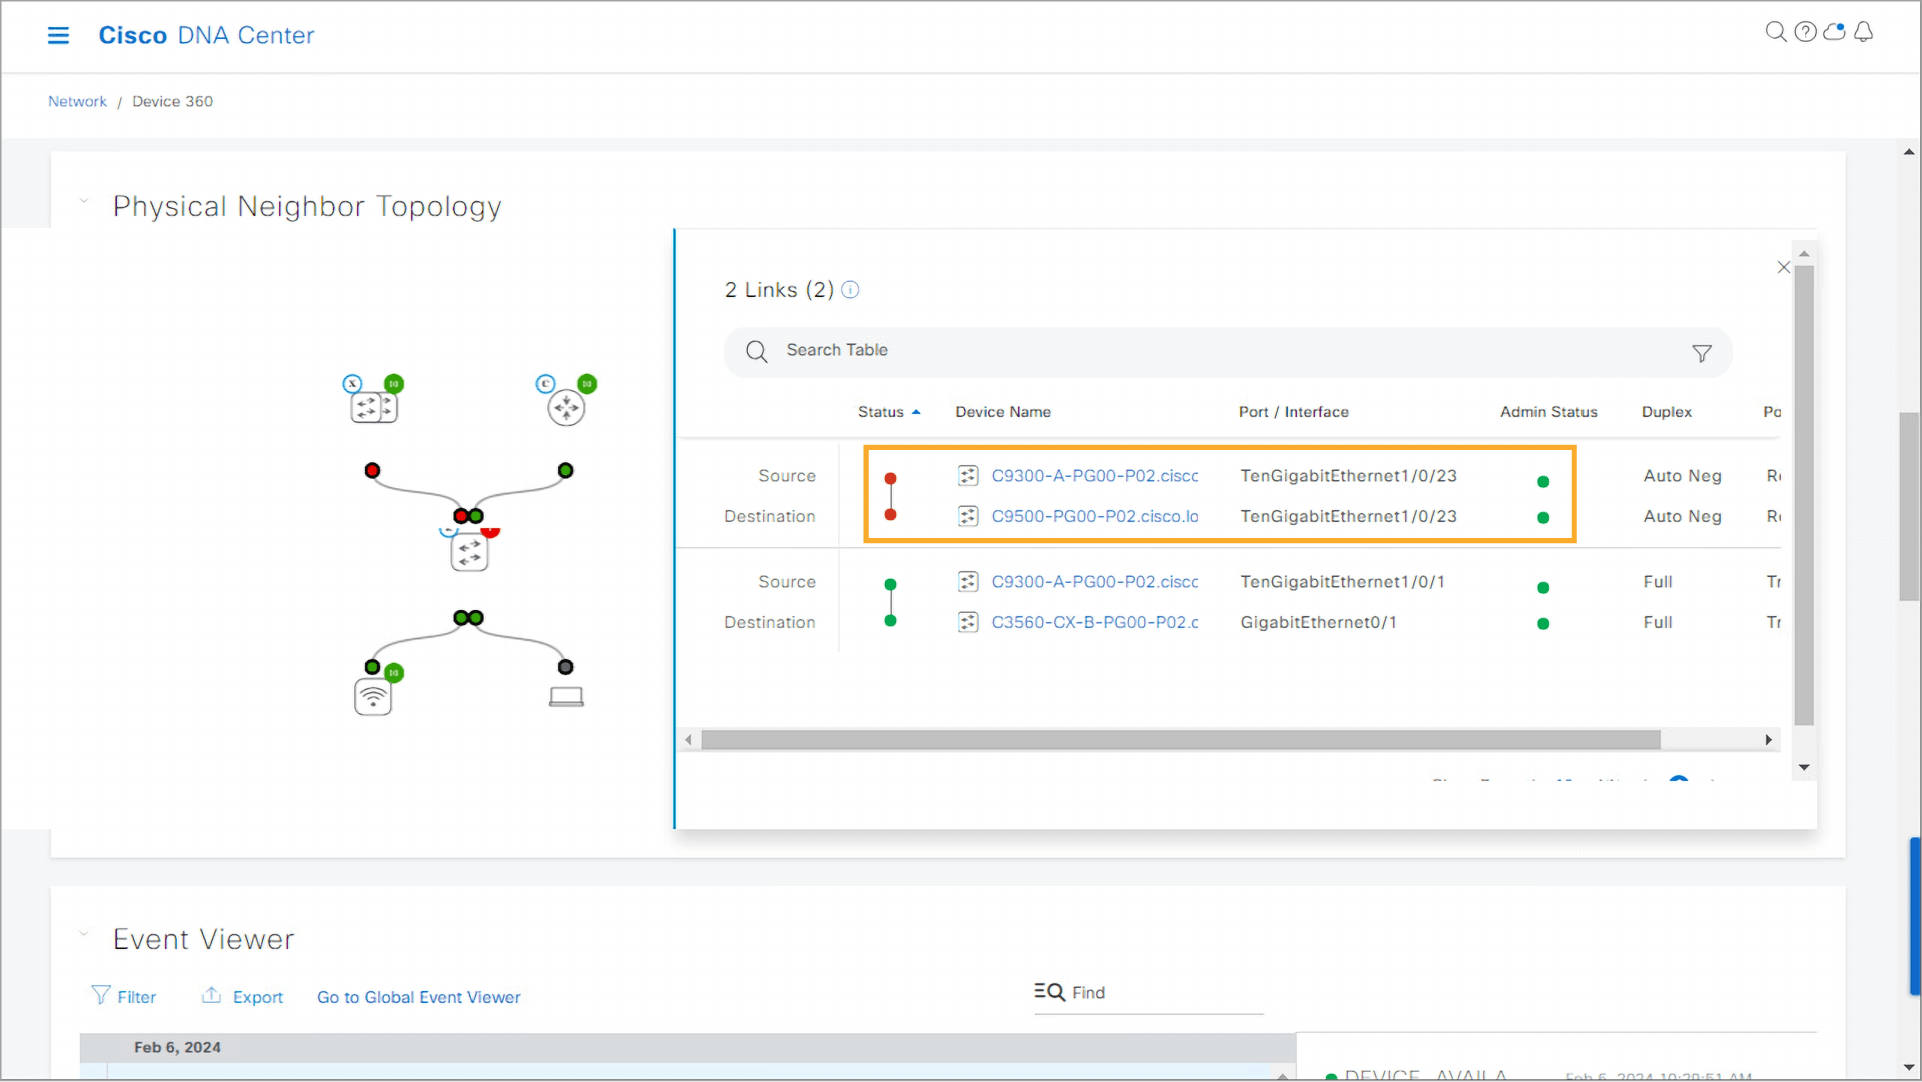
Click the link between the devices that is marked by two red circles.
Details about the devices and interfaces are displayed. Observe that the TenGigabitEthernet 1/0/23 interfaces on both the C9300-A access switch and C9500 core switch are down (indicated by red color), even though the admin status of the interfaces is up (indicated by green color). This could indicate the problem on the link between the switches, resulting in decreased health of the core switch and connectivity issues to the rest of the network on the access switch.

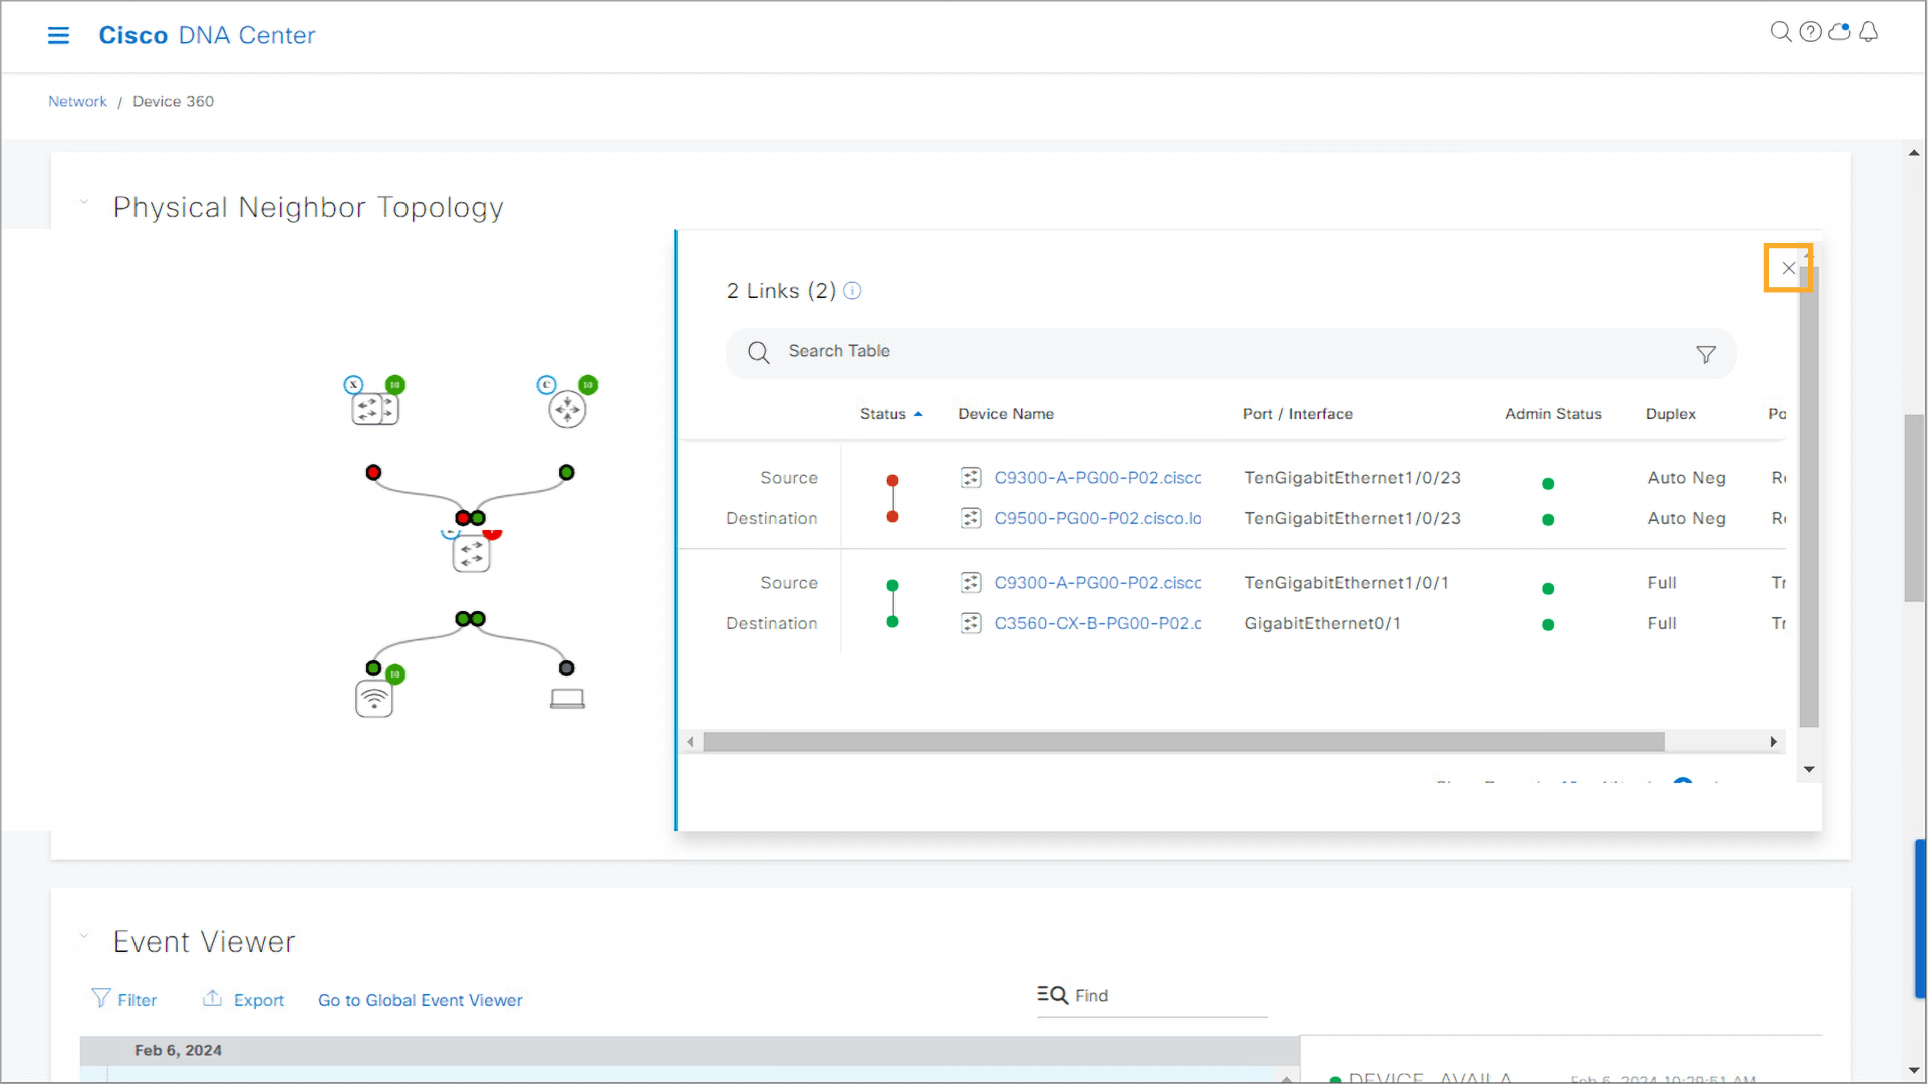
Step 23:
- Click X in the upper-right corner of the window to close it.
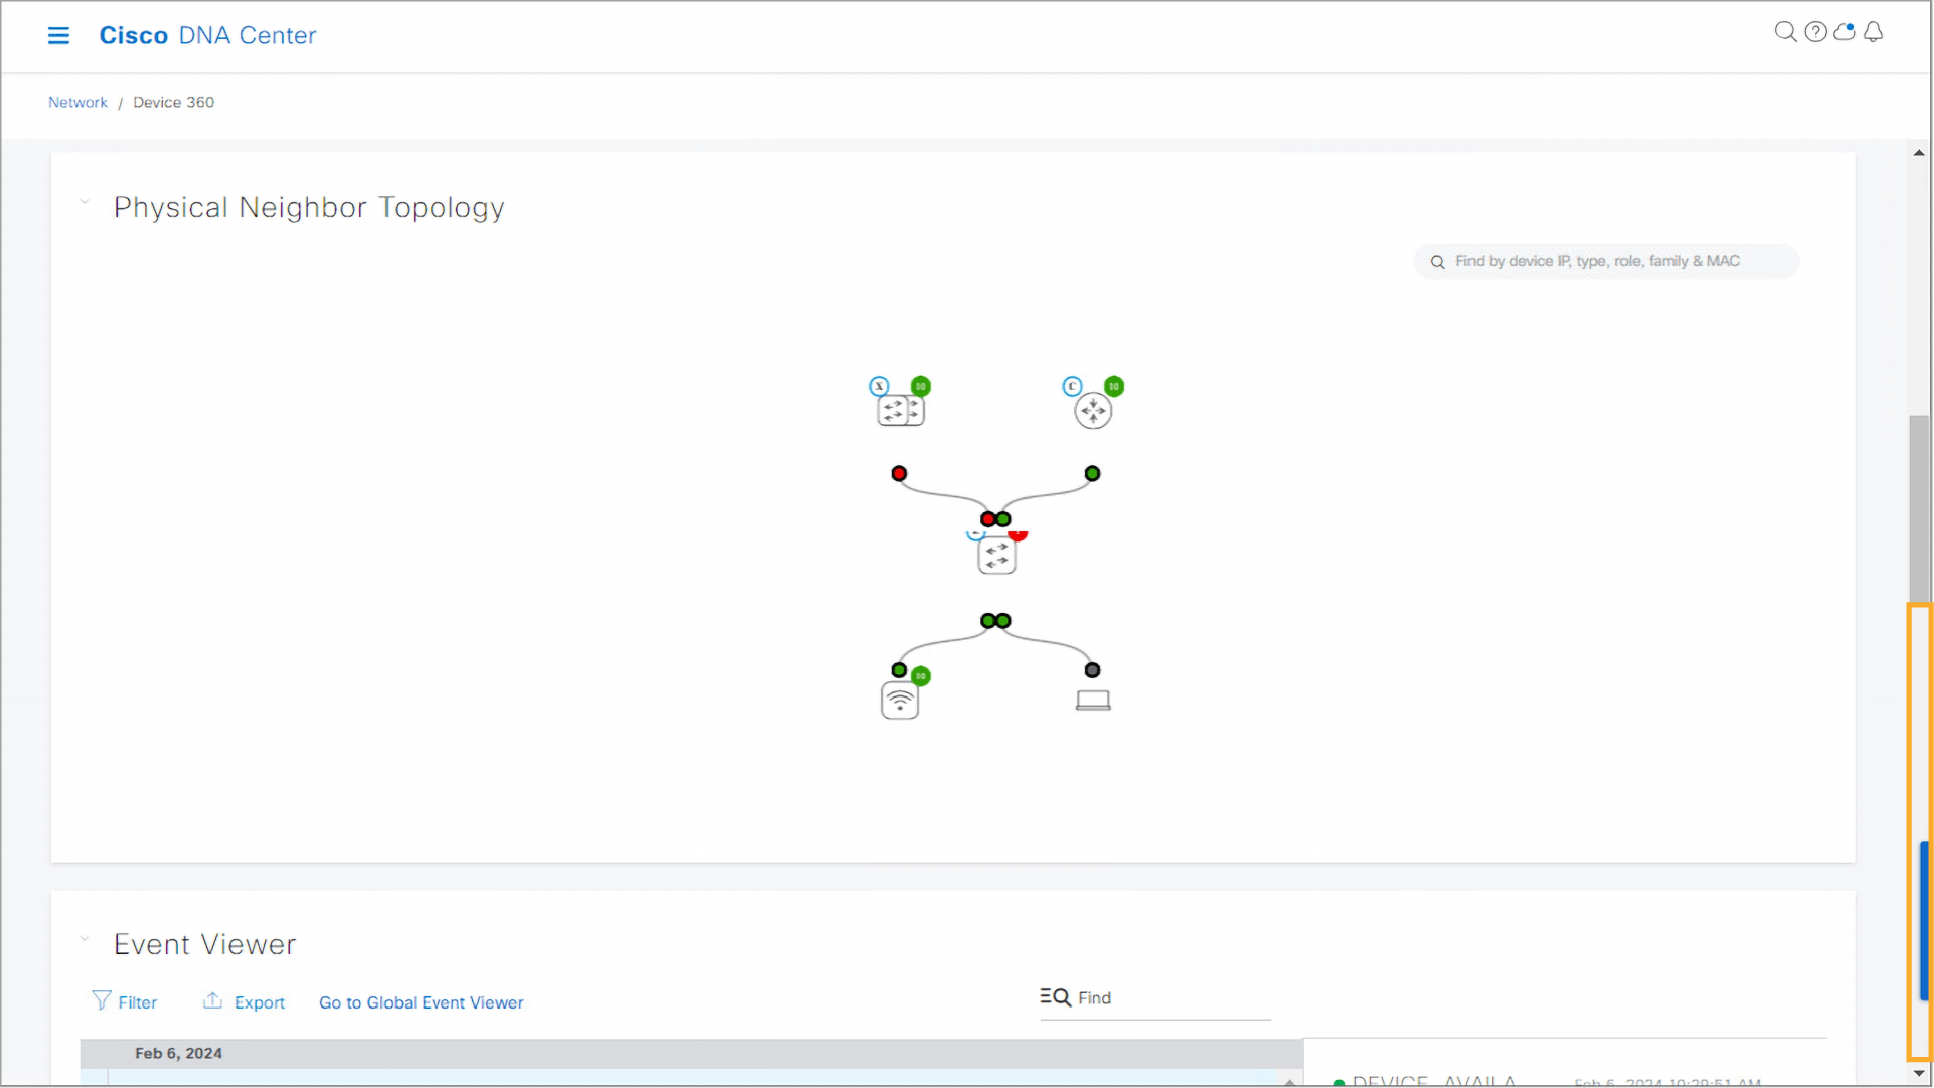
Step 24:
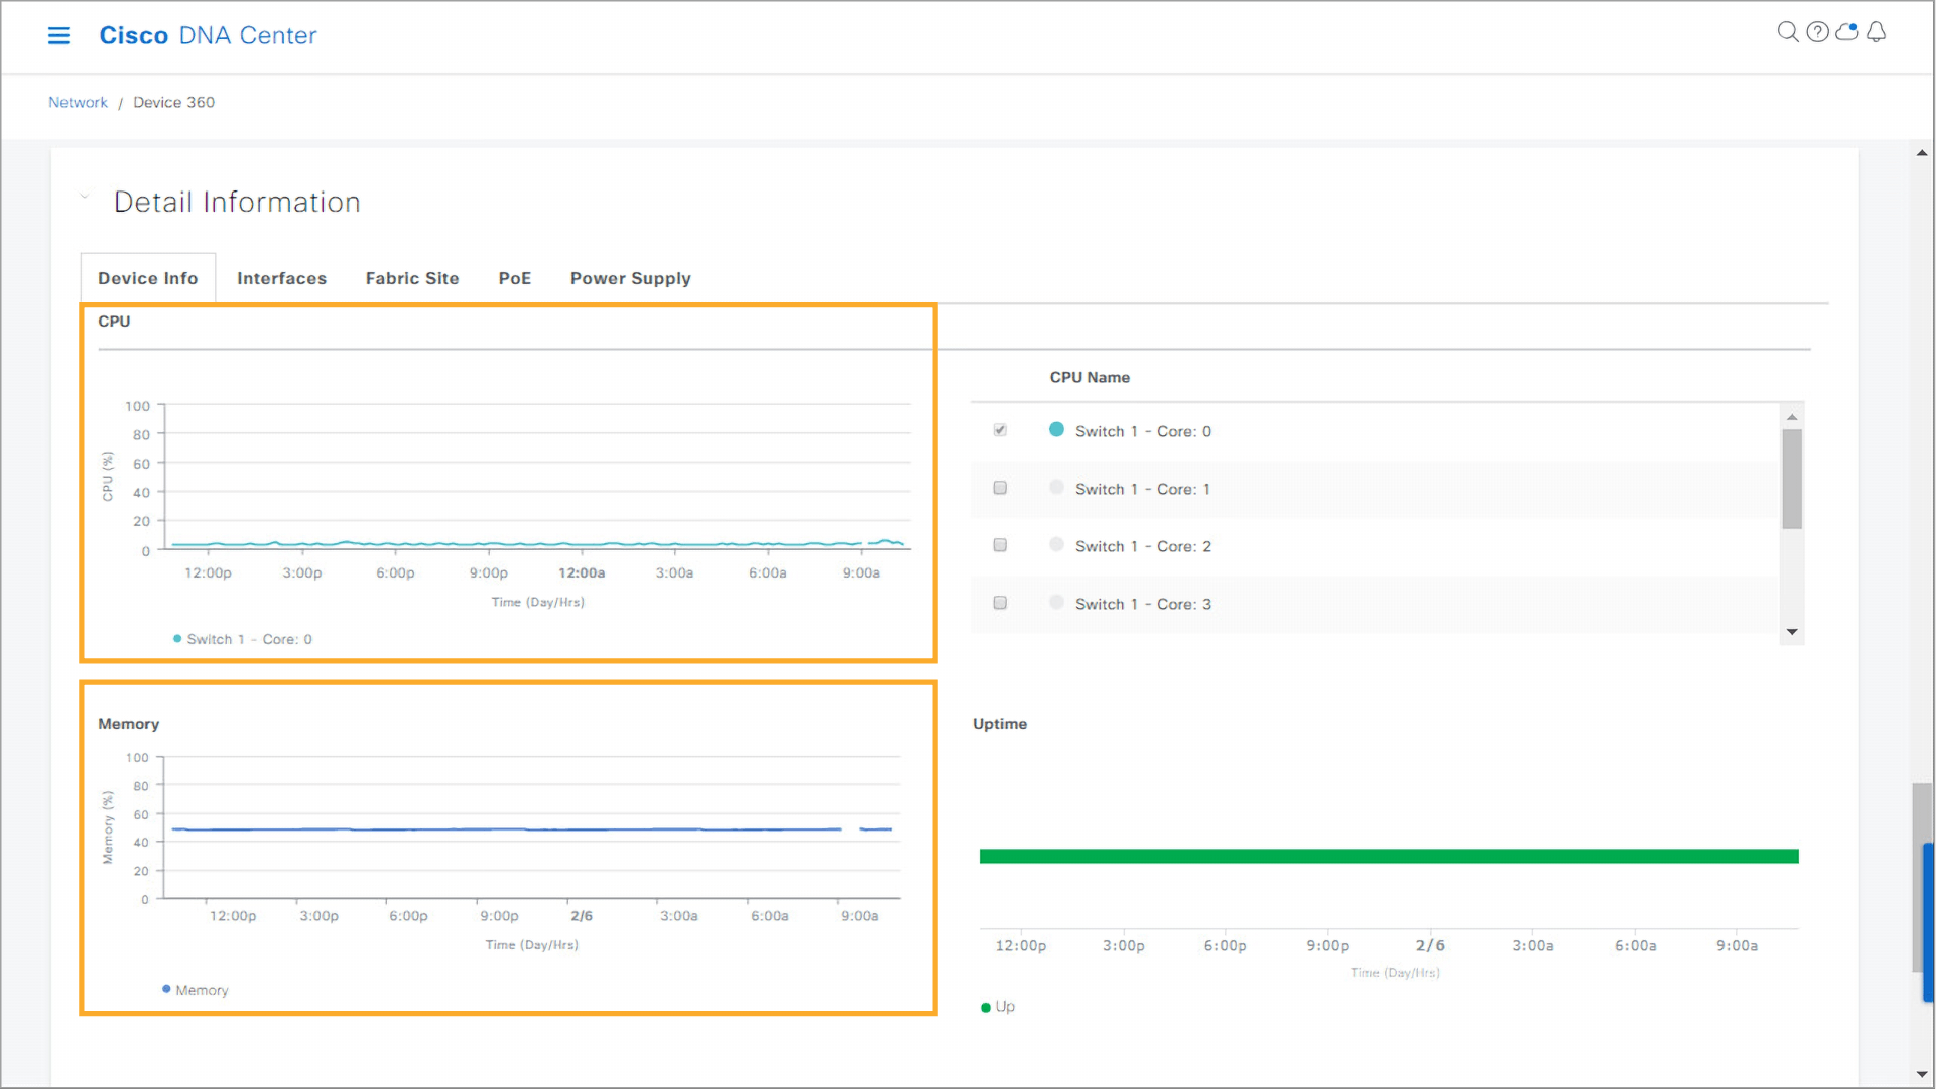
- Verify if there are any unexpected values for CPU and memory usage.
- Click the bottom part of the scroll bar to scroll down the page and examine the detail information for the switch.
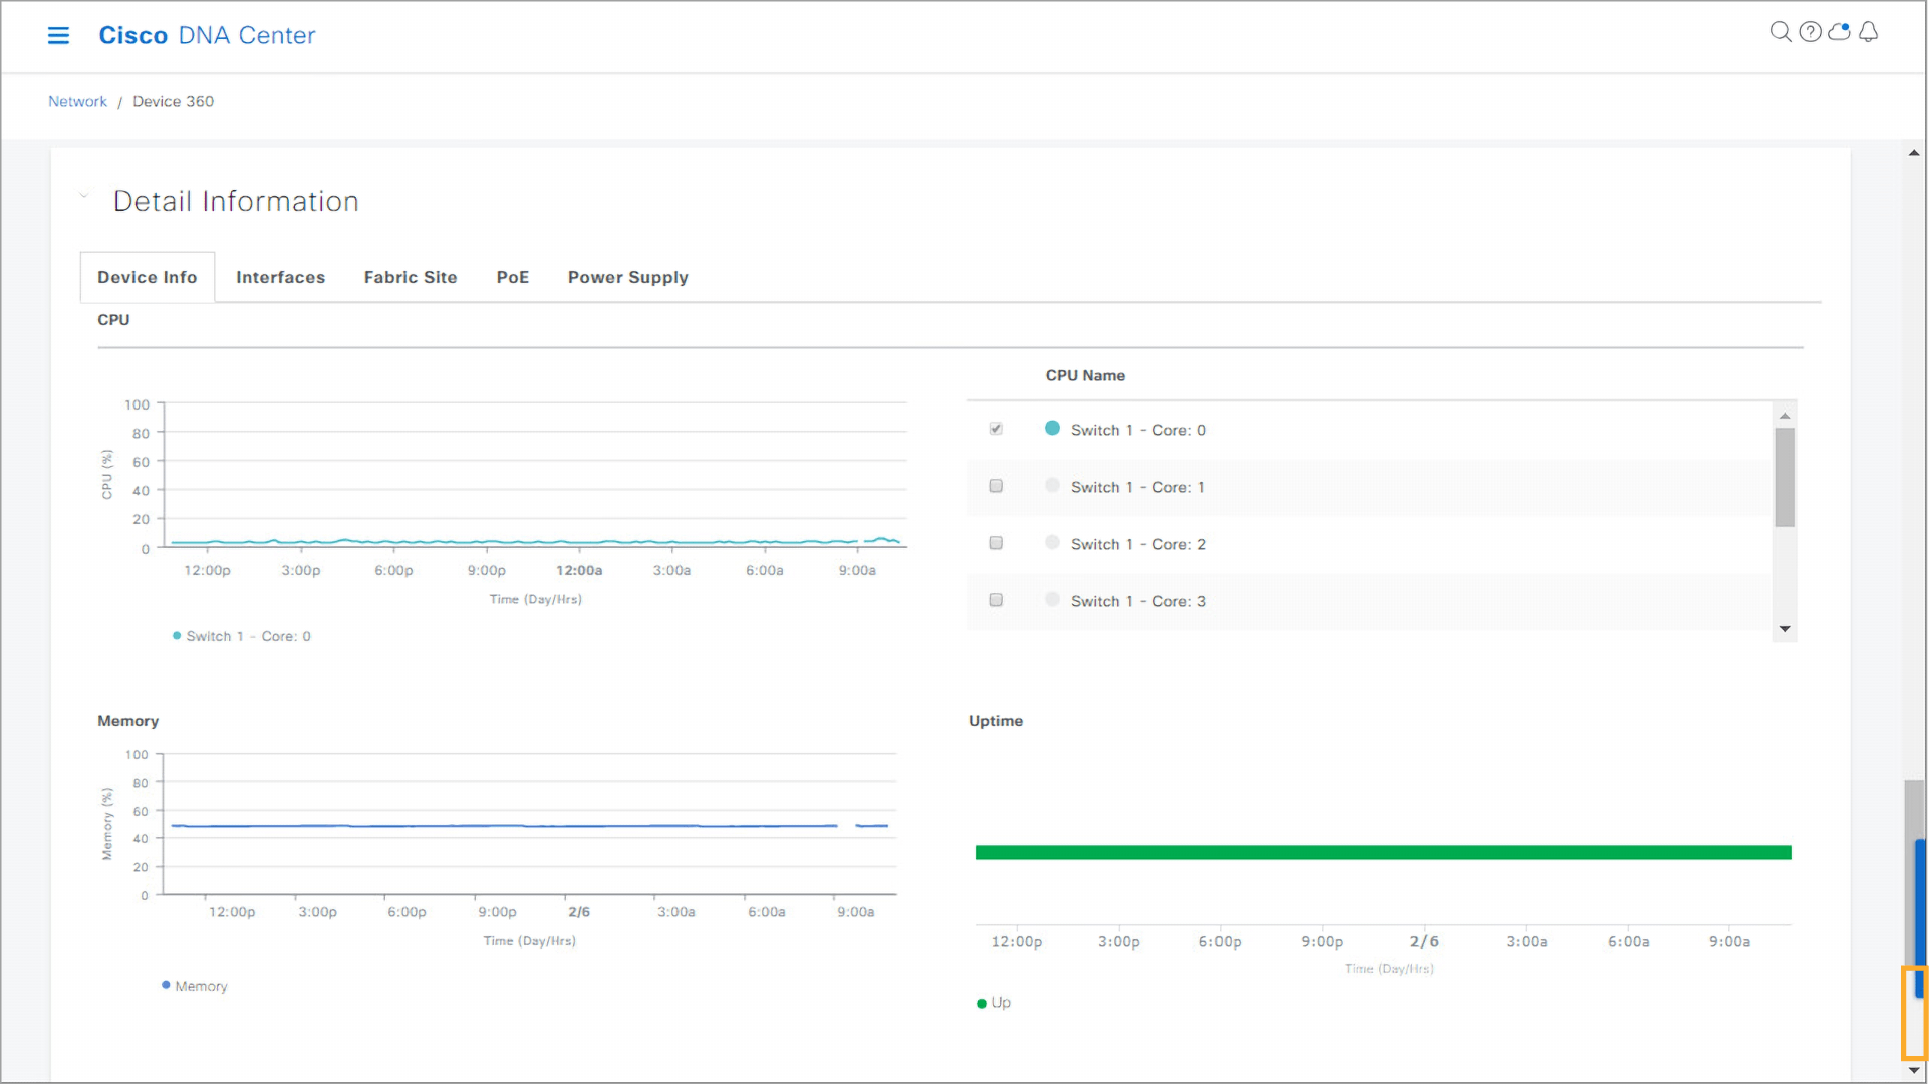
- The Detail Information dashlet displays details such as CPU usage and memory usage. You can choose which CPU core to include on the timeline. You can see that no unexpected values are detected for CPU and memory usage.
Step 25:
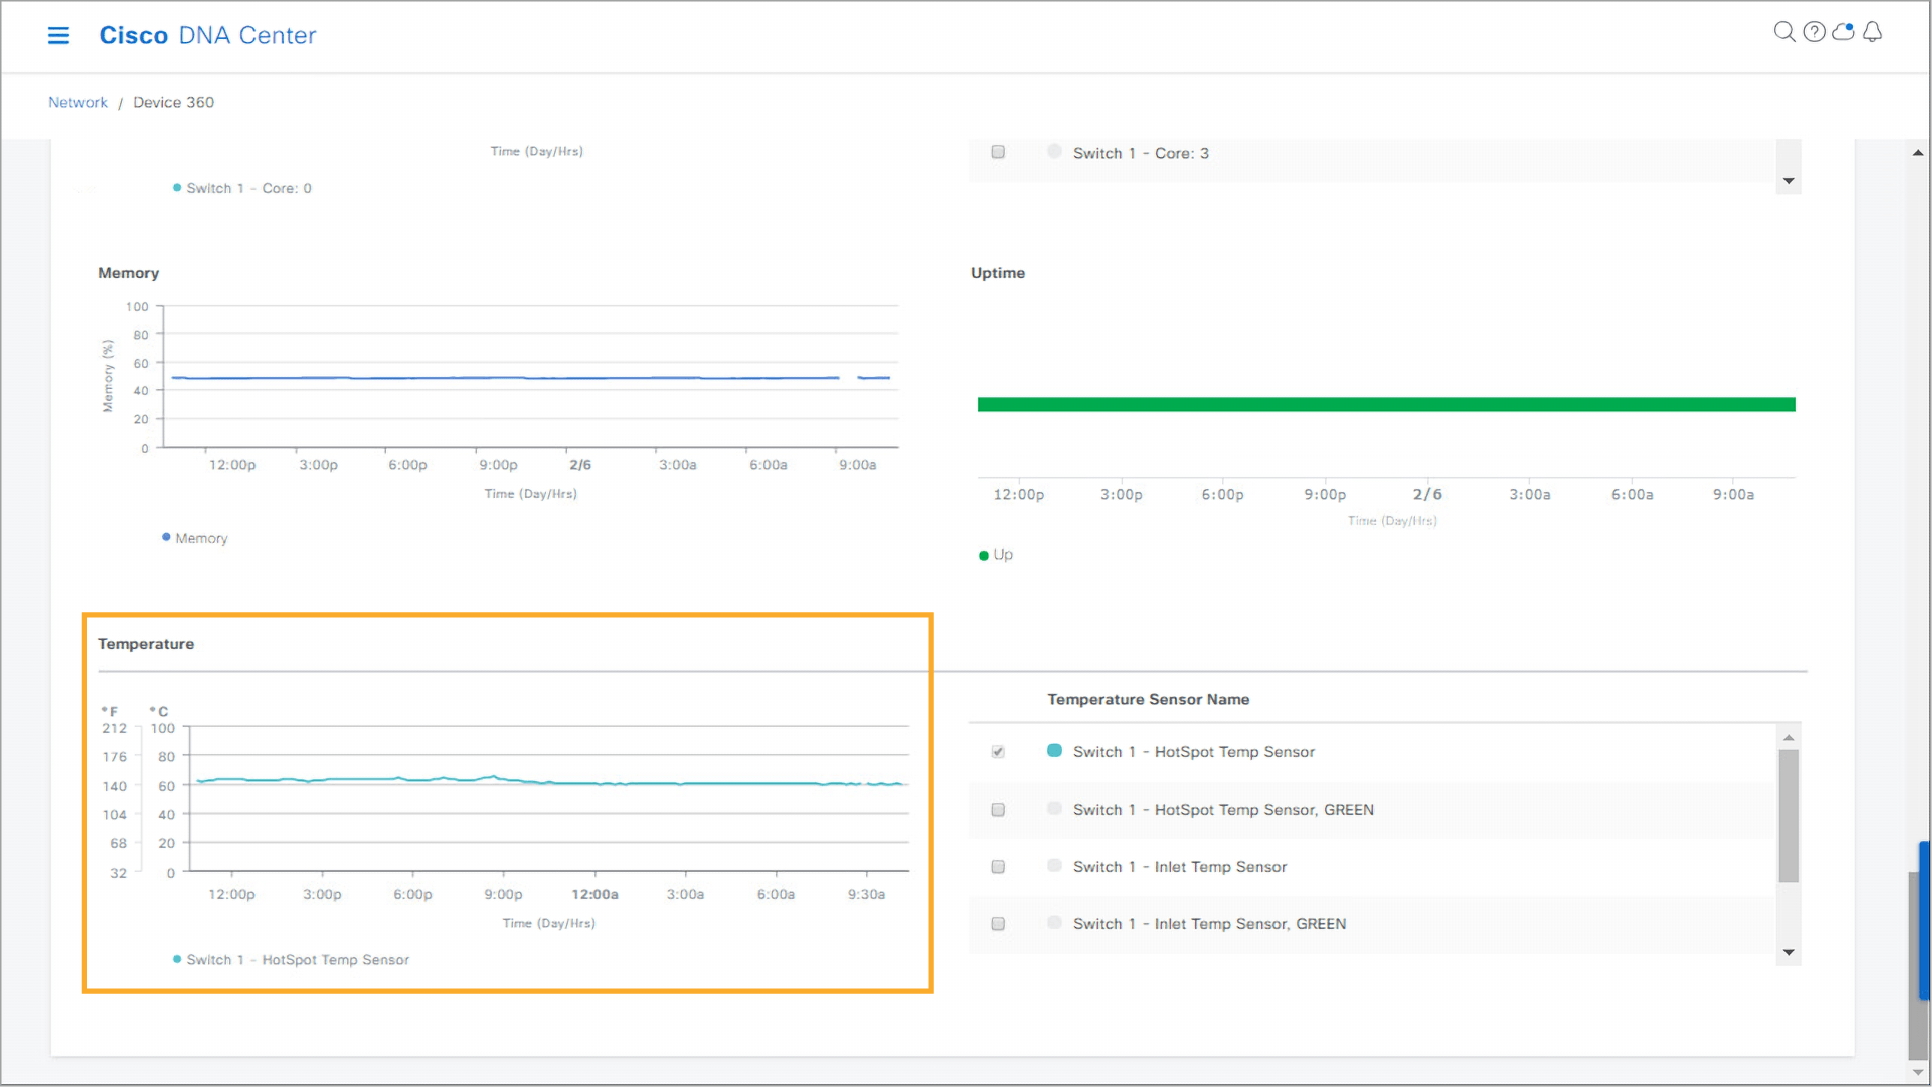
- Examine the Temperature section of the Detail Information dashlet and verify if there is high temperature detected on the switch.
- Click the bottom of the scroll bar to scroll down to the bottom of the page and examine the temperature for the switch.
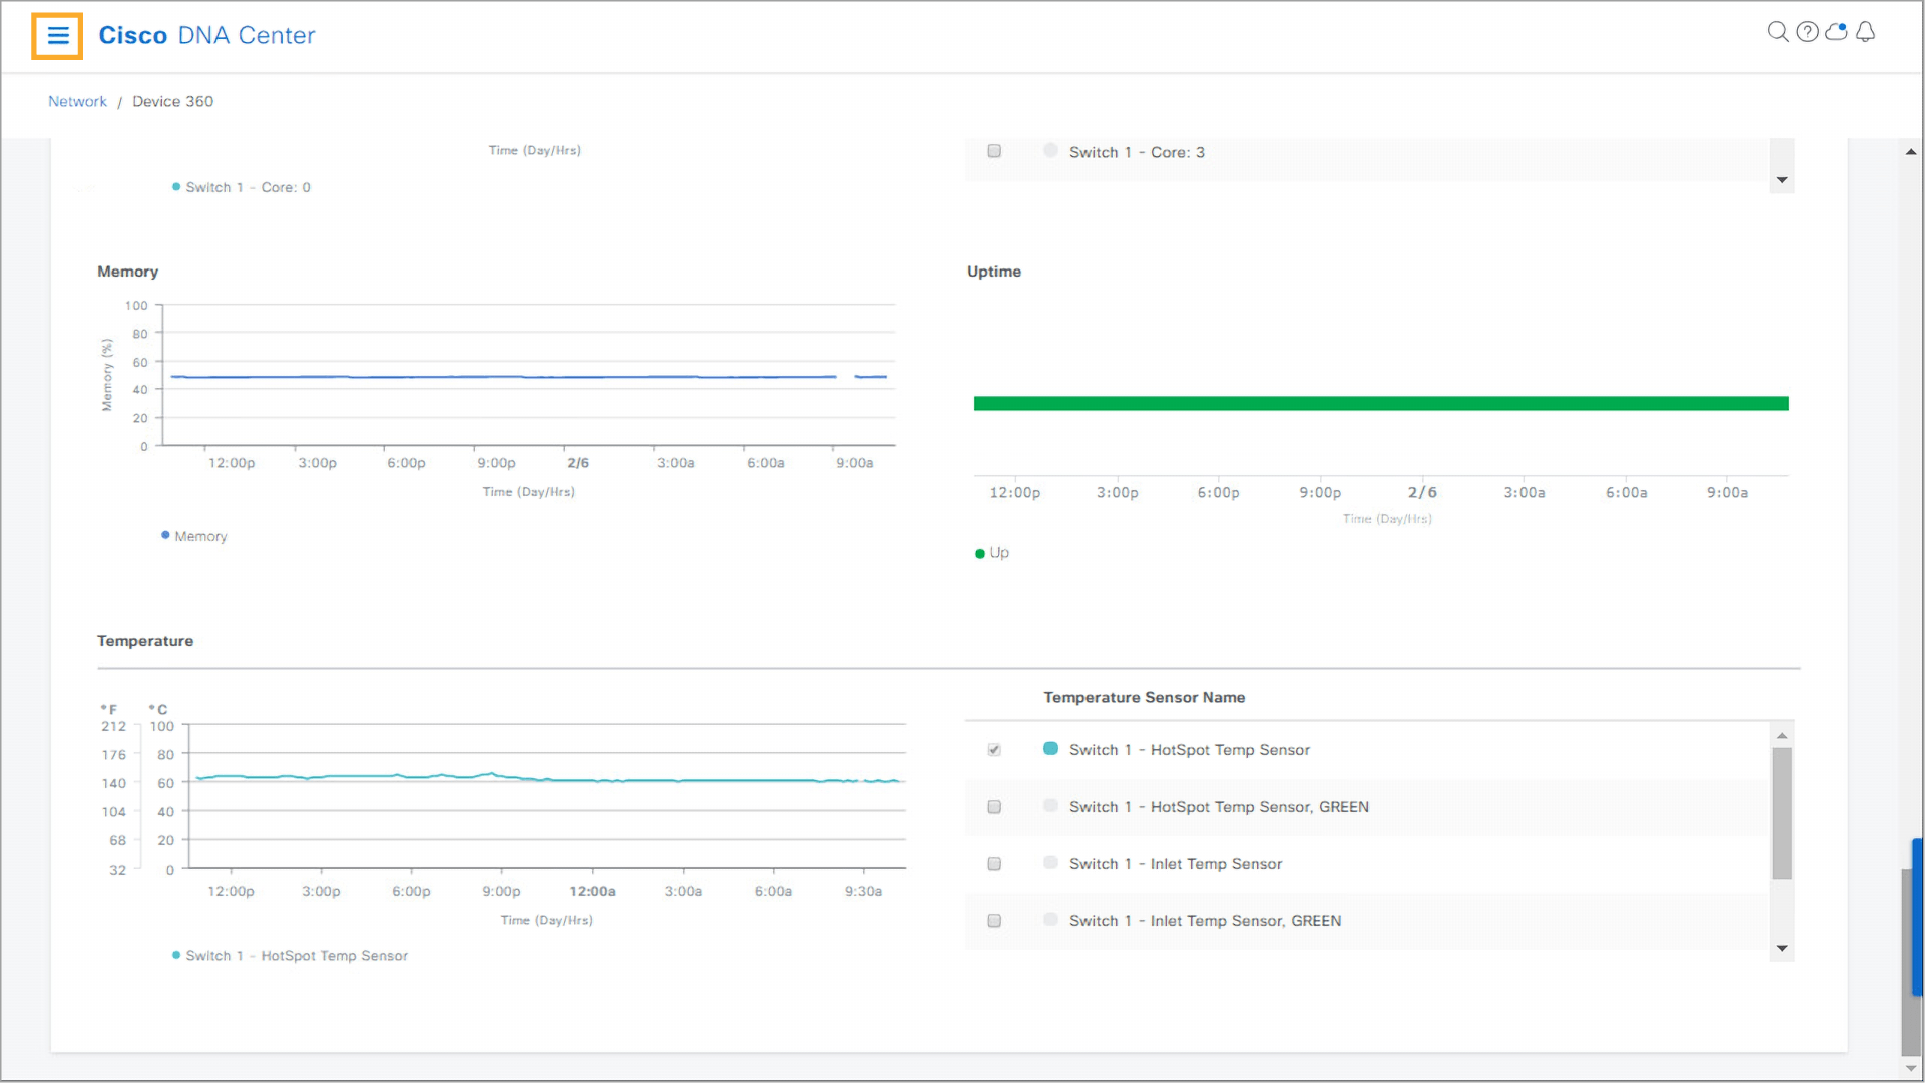
- The Temperature dashlet includes a temperature timeline and check boxes where you can add sensors to the graph. You can see that there is no high temperature detected on the switch. Based on the information gathered from the Device 360 view, you can conclude that the reported issues stem from the connectivity issues on the switch.
In a real environment, you could also verify interfaces status, fabric site status, Power over Ethernet (PoE) information, and power supply information inside the Detail Information dashlet.
Note: To continue with Step 26, proceed to the next topic.
In the previous steps, you observed that the reported issues stem from the network connectivity issues on the access switch. In this task, you will further examine the details of the problem by looking at the issues that were detected by Catalyst Center.
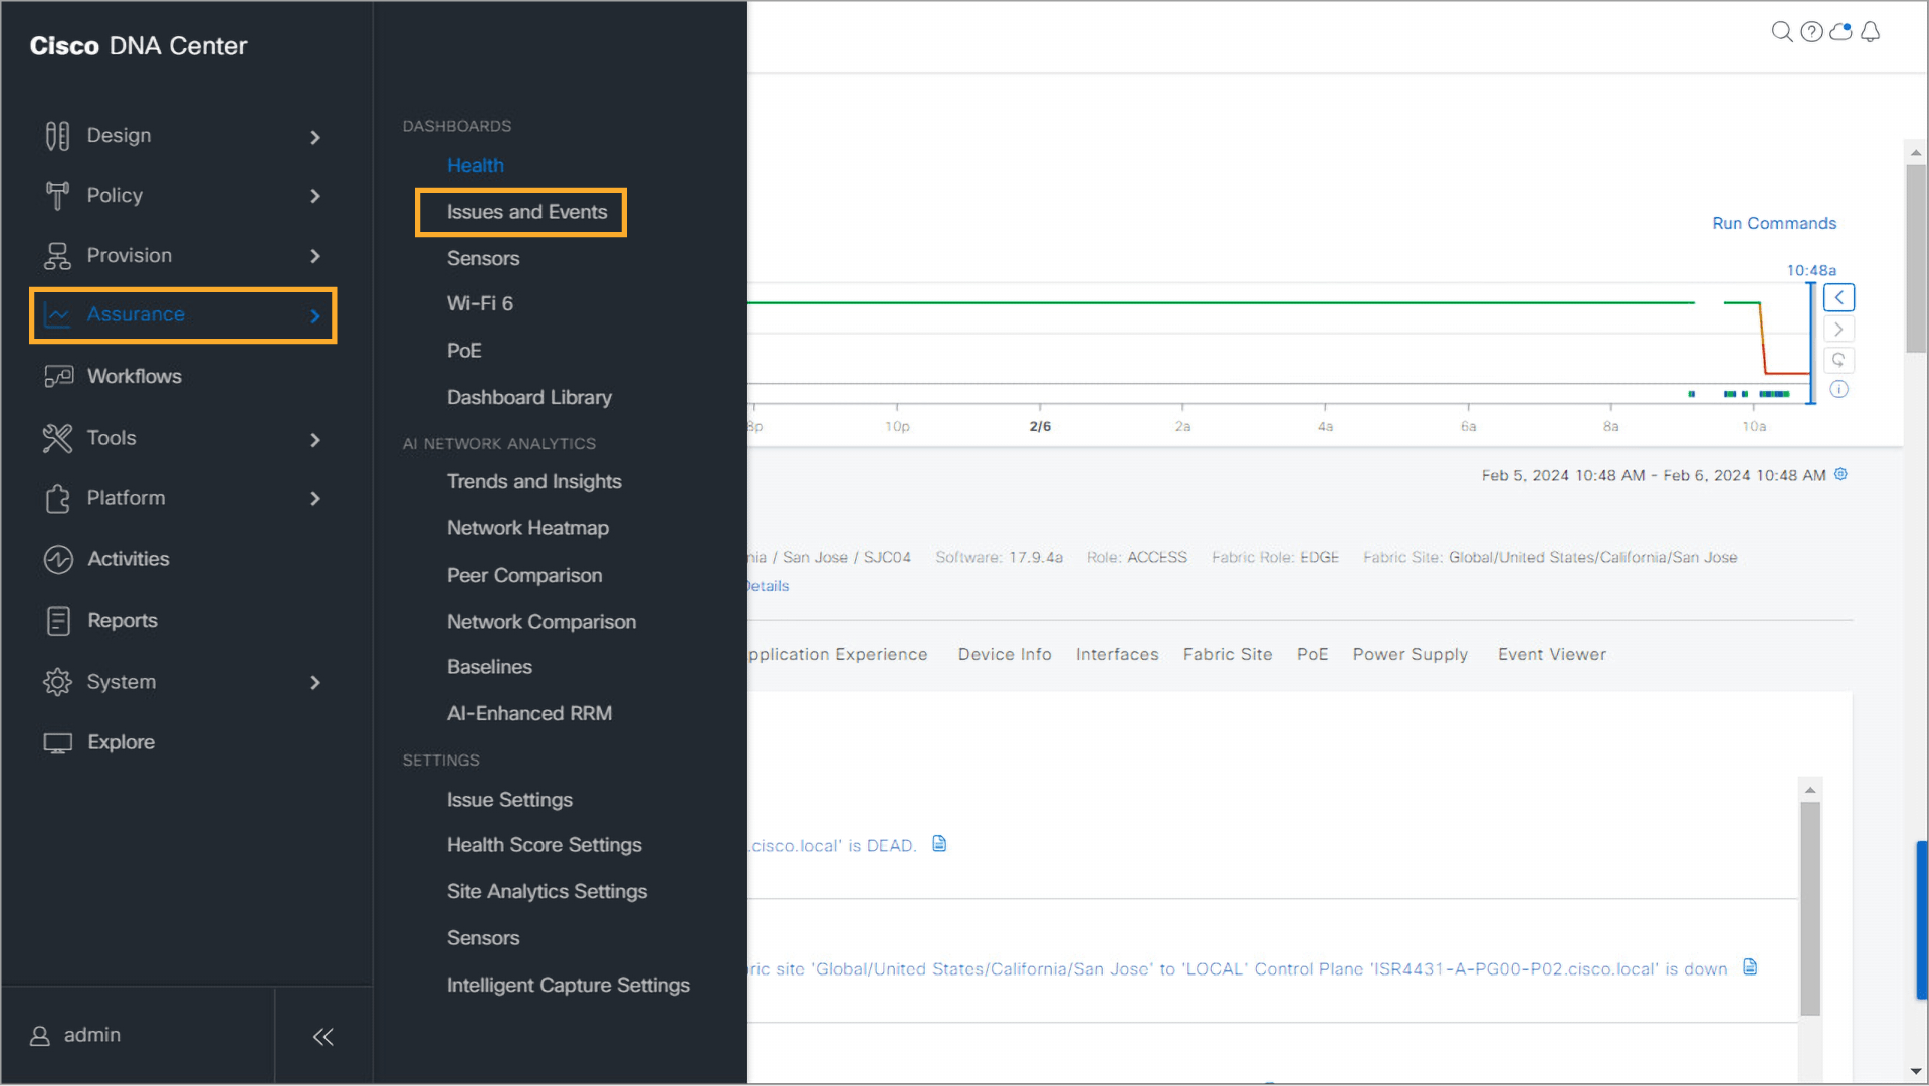
Step 26:
- From the network Device 360 view, open the Catalyst Center menu and navigate to Assurance > Issues and Events.
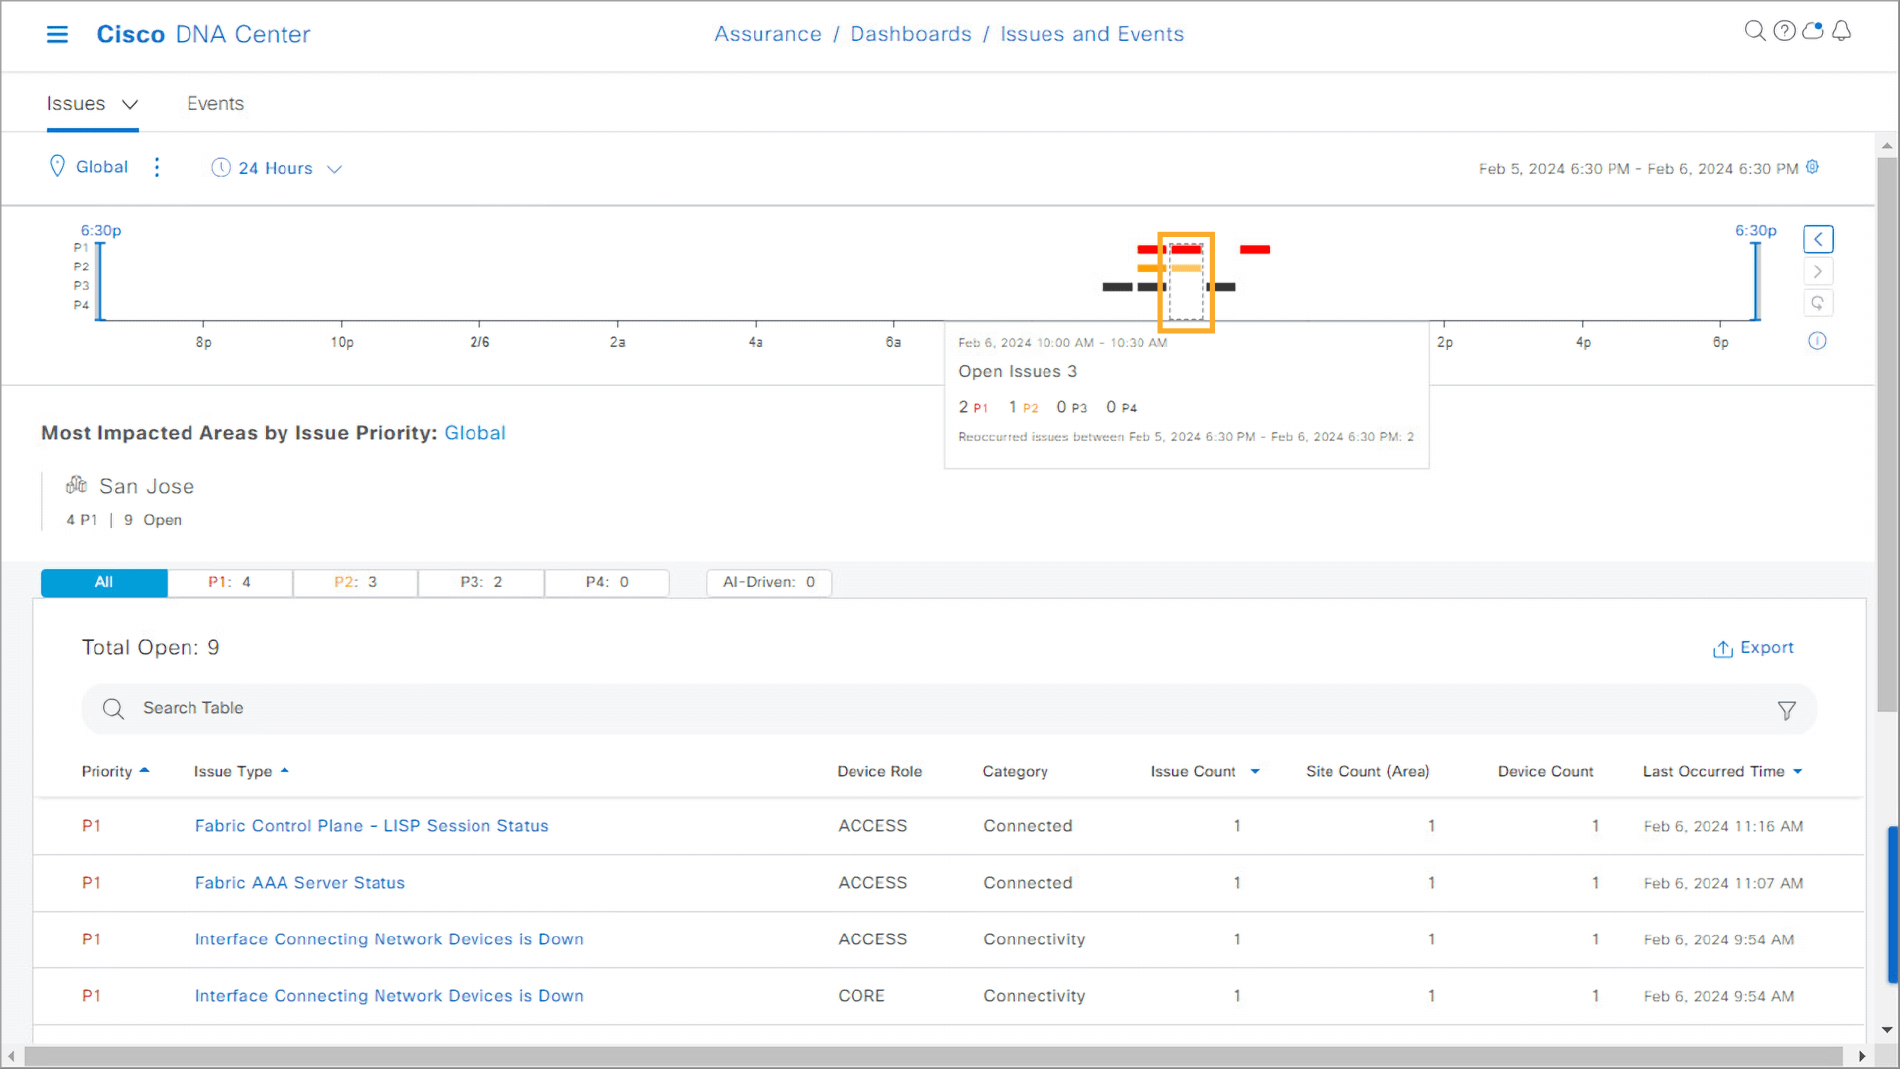
Step 27:
- Examine the Issues timeline dashlet, which displays the distribution of issues with different priorities over time. Click the timeline where priority 1 and priority 2 issues were detected. You can see that several issues were detected.
Step 28:
- Click the bottom part of the scroll bar to scroll down to the bottom of the page and examine the issues. You can see many issues related to ACCESS and CORE devices, indicating the problems that you already observed.
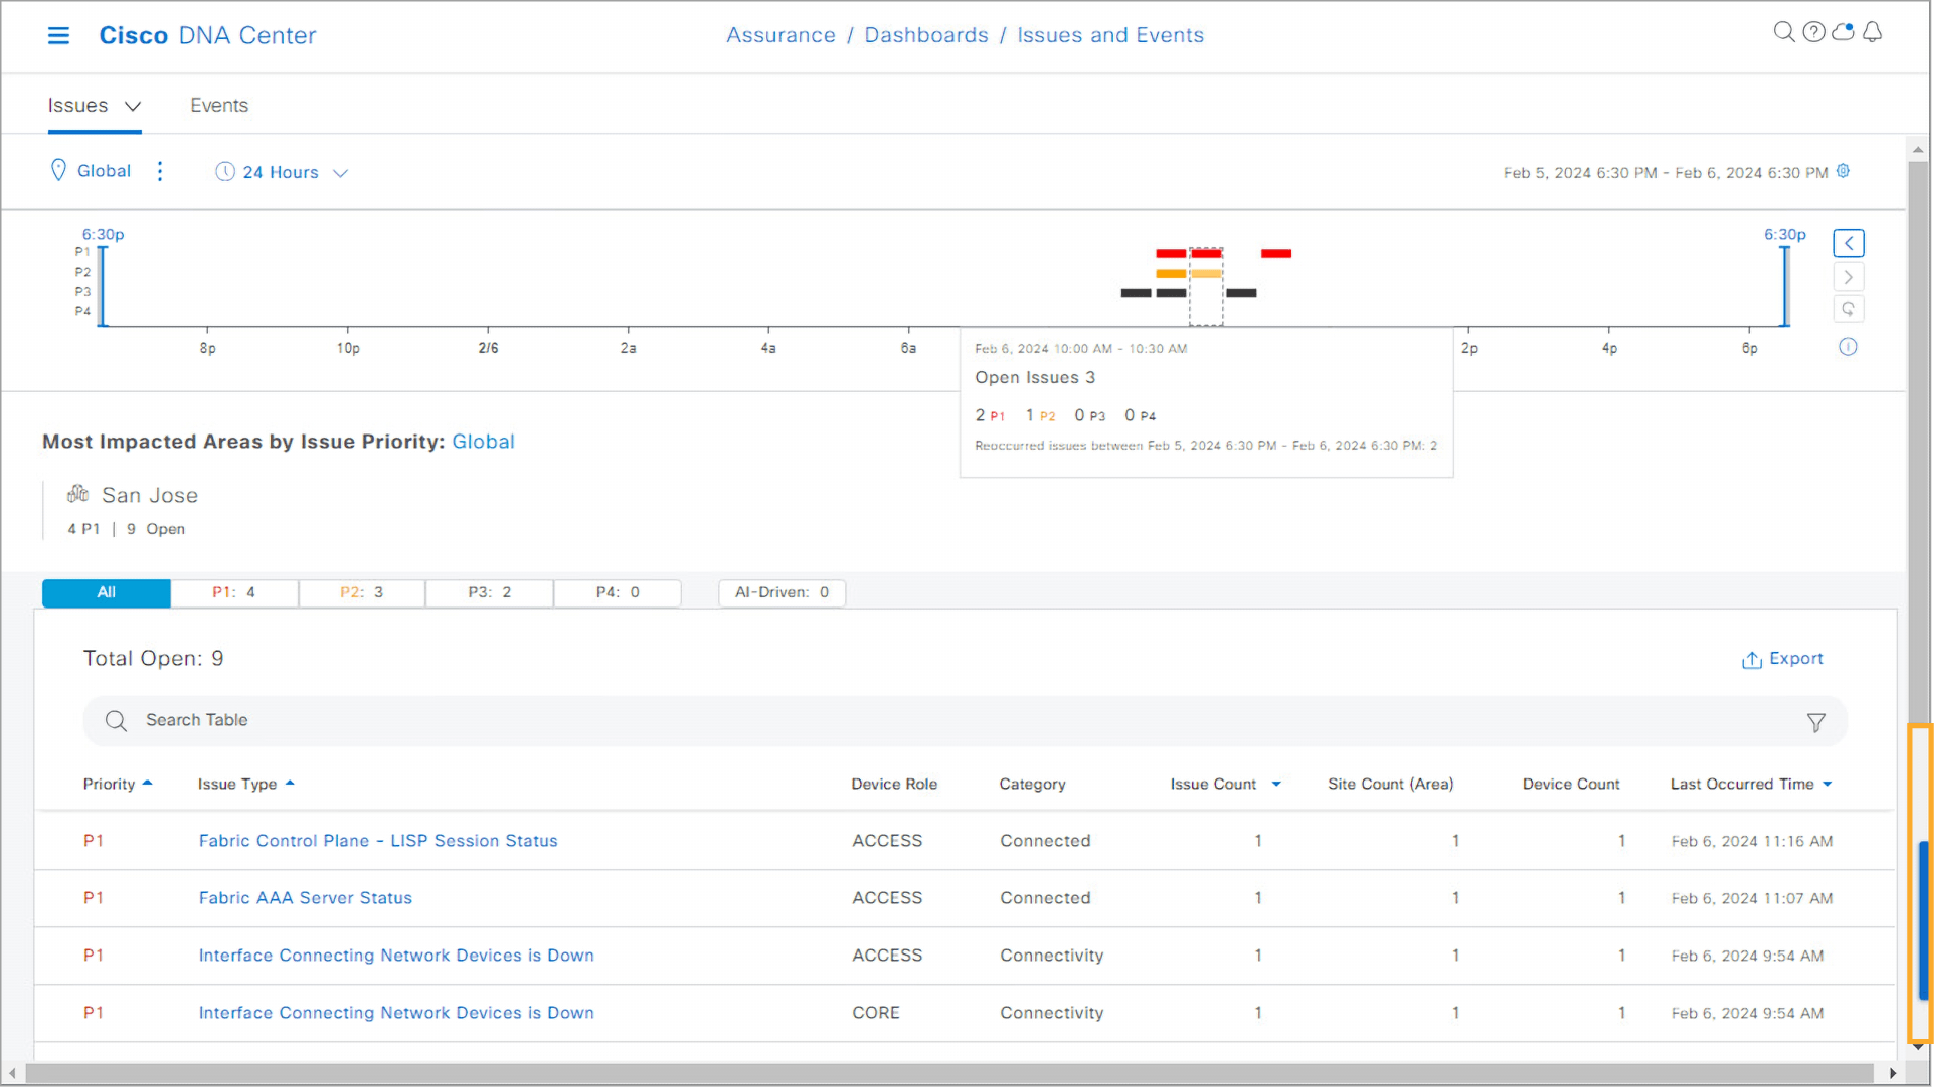

Again, it seems that the interface going down on the access switch resulted in many problems that are related to connectivity from that switch.
Note: To continue with Step 29, proceed to the next topic.
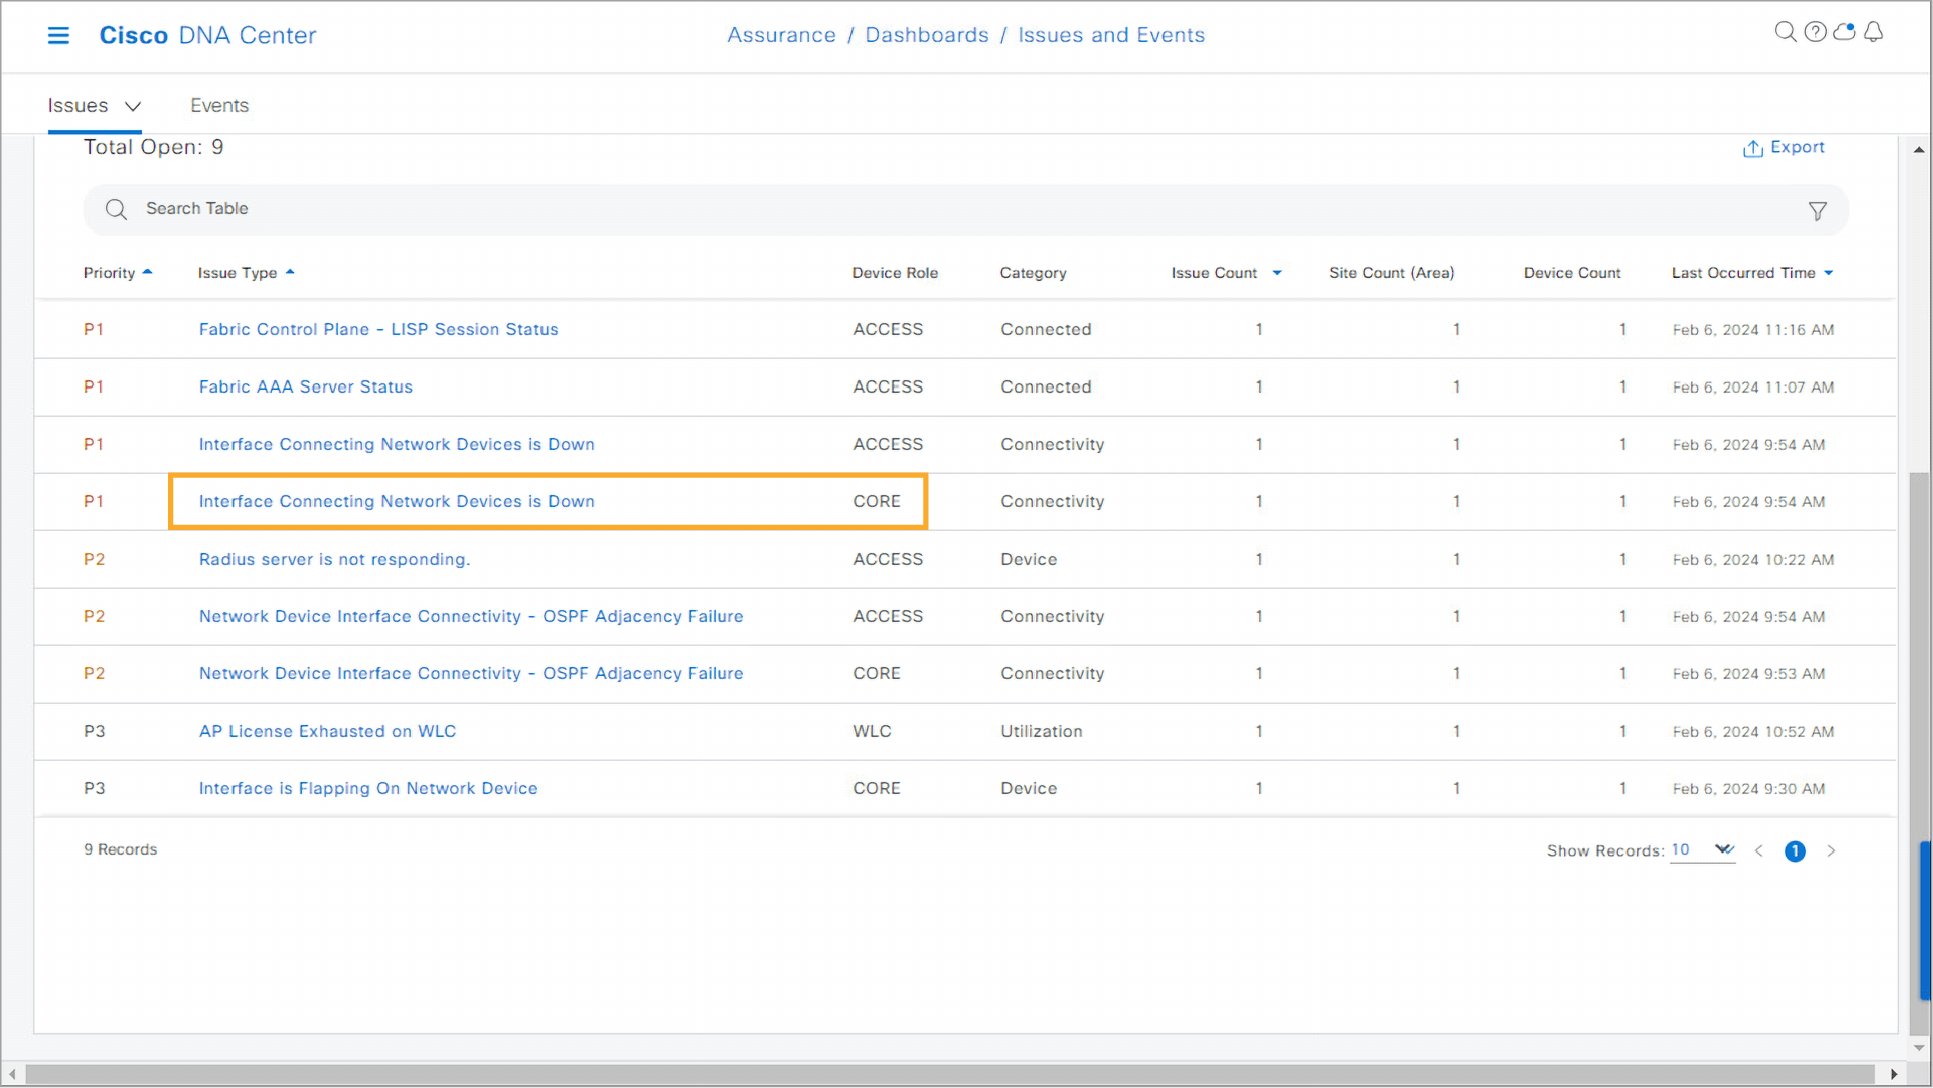
Step 29:
- Click the Interface Connecting Network Devices is Down link for the CORE device role.
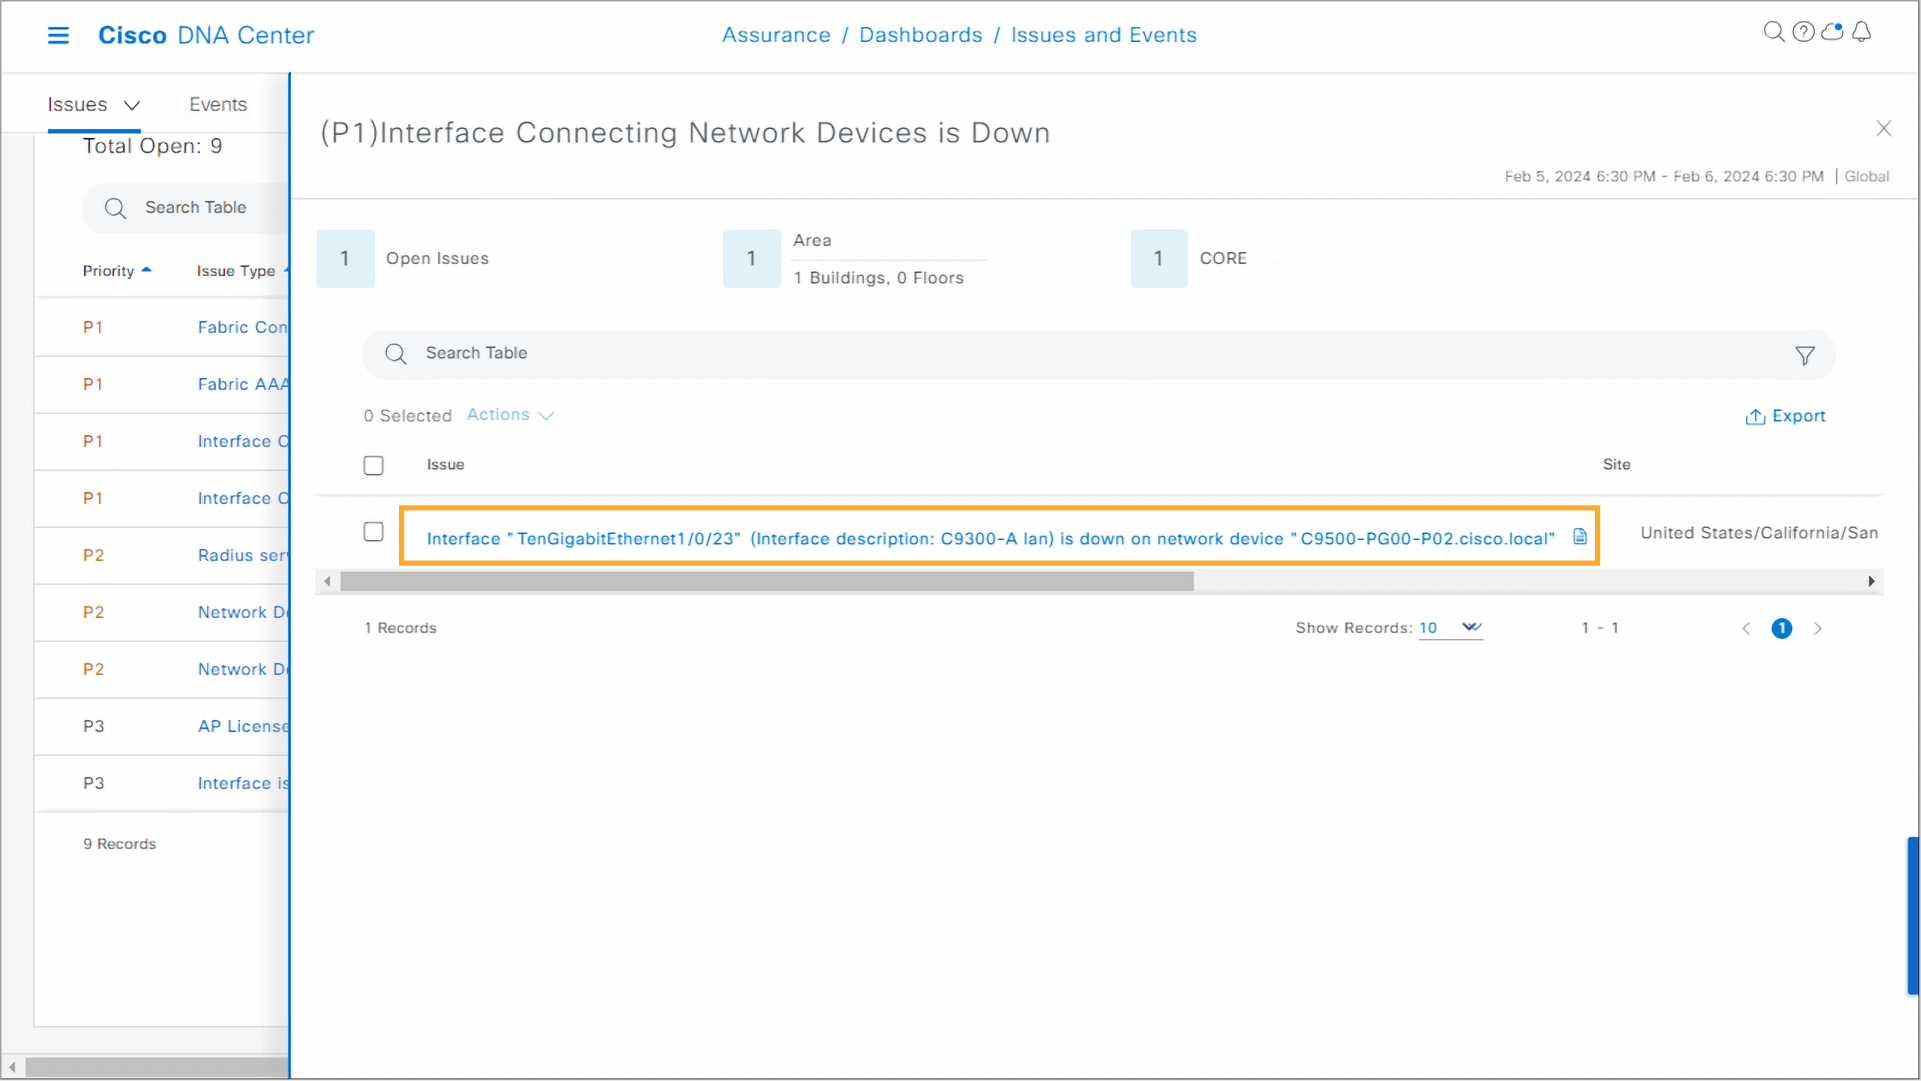
Step 30:
- A new window opens with all occurrences of that issue. In this case, there is one occurrence. Open the details of the issue occurrence by clicking the Interface “TenGigabitEthernet1/0/23” (Interface description: C9300-A lan) is down on network device “C9500.cisco.local” link.
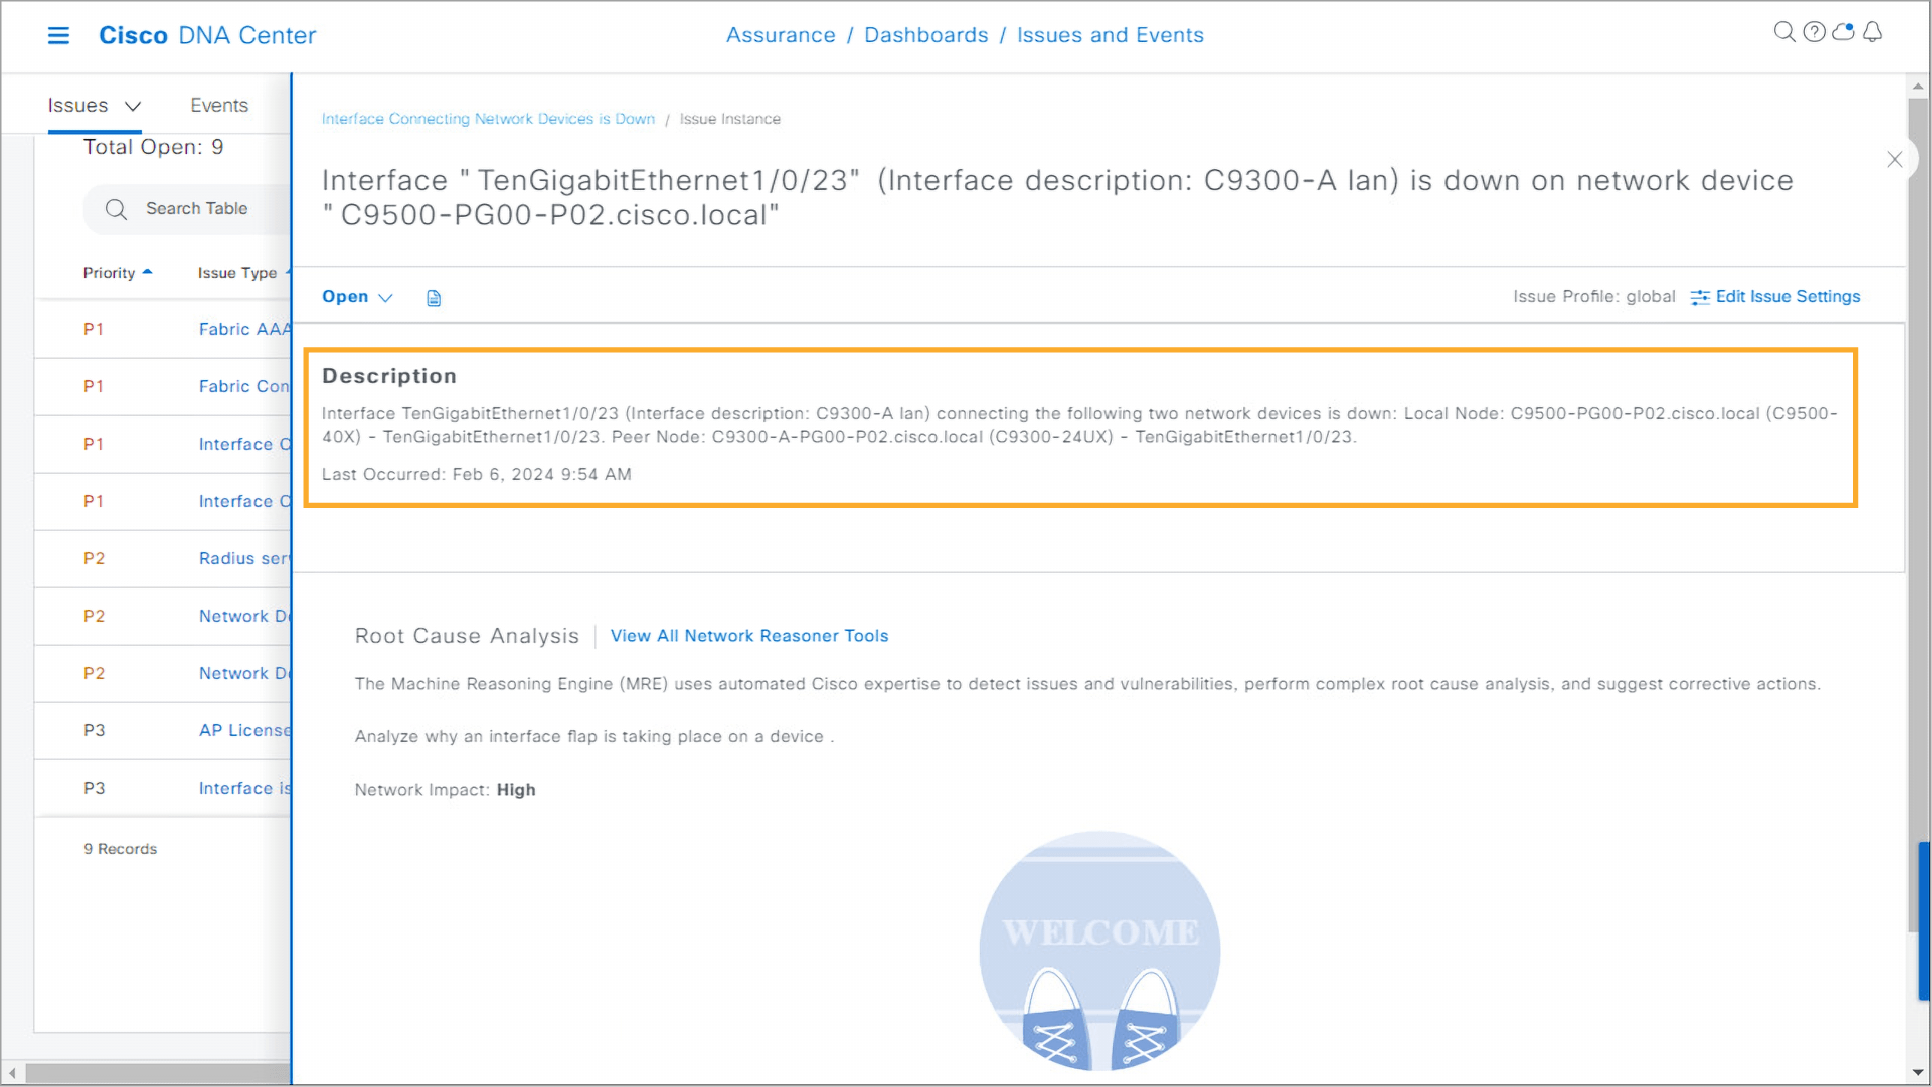
Step 31:
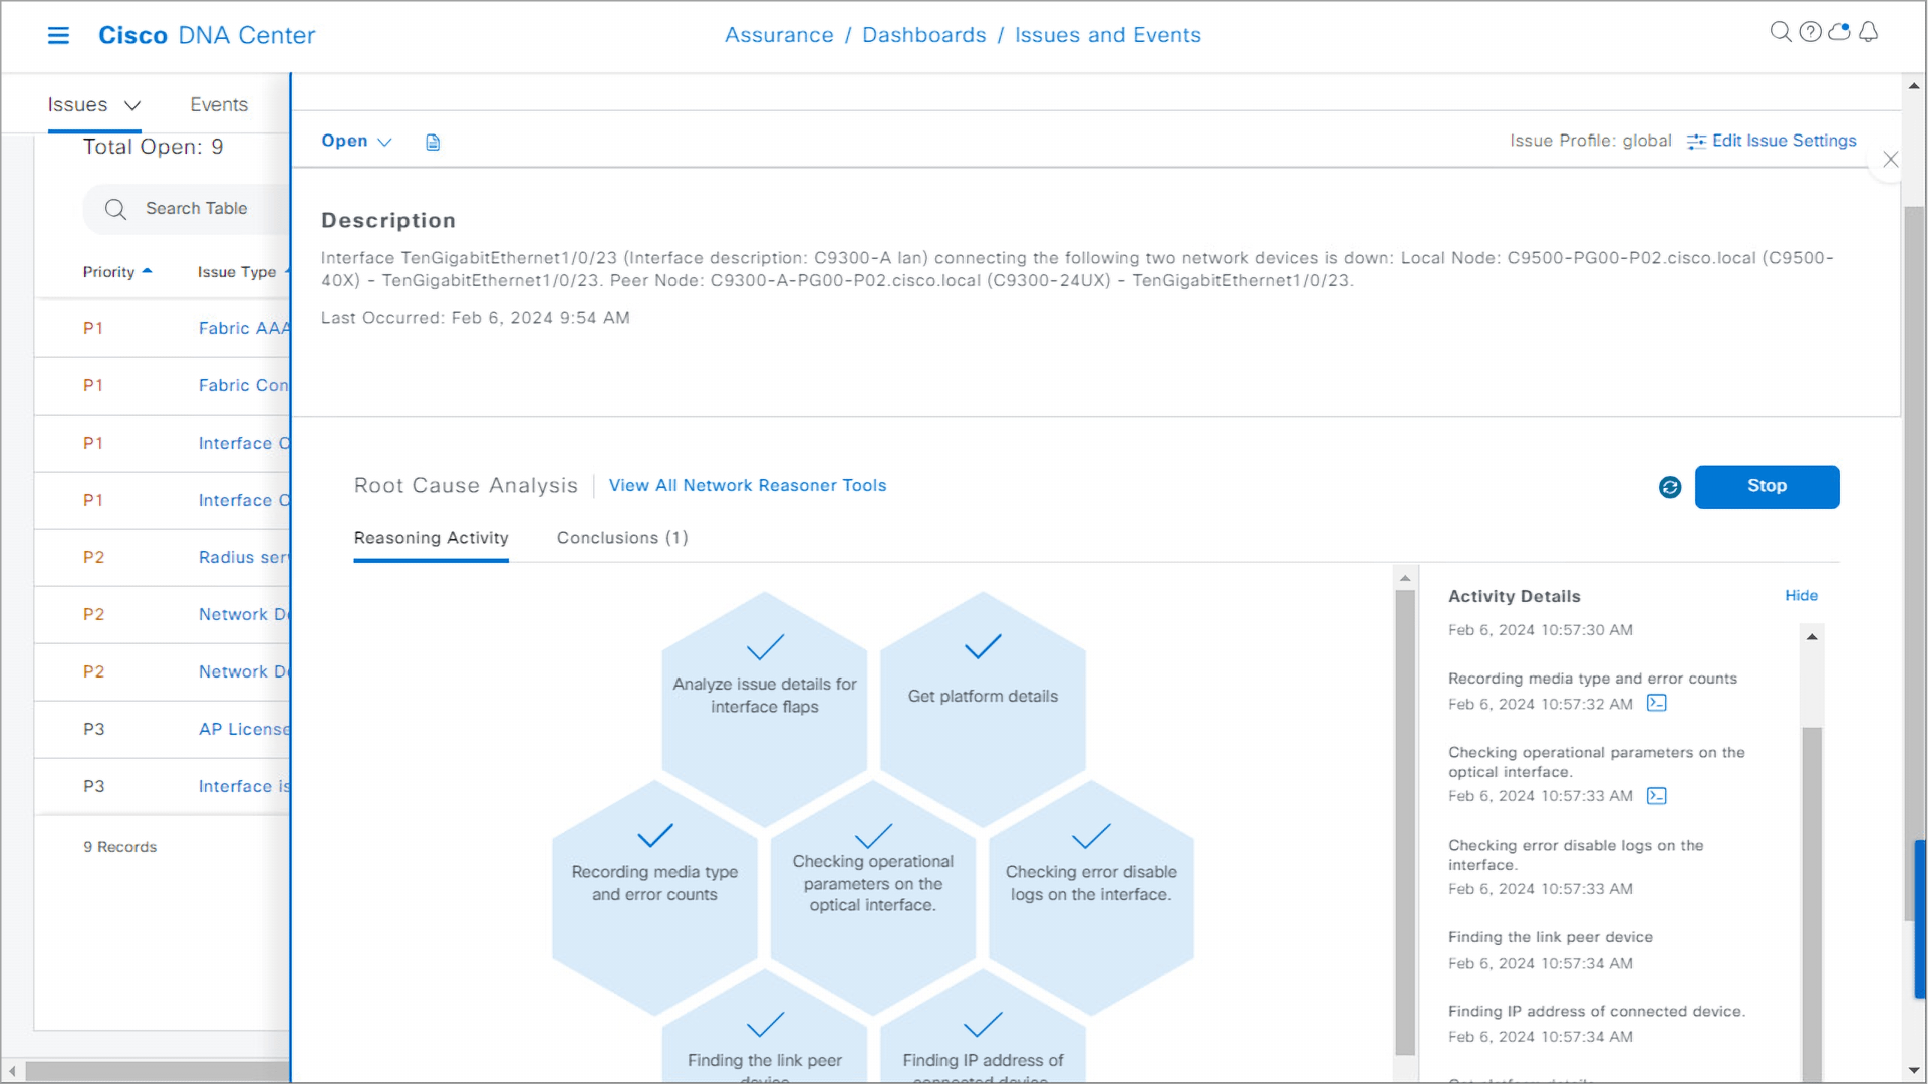
- From the issue description, you can see that the TenGigabitEthernet1/0/23 interface connecting the C9300-A and C9500 devices is down on both devices.
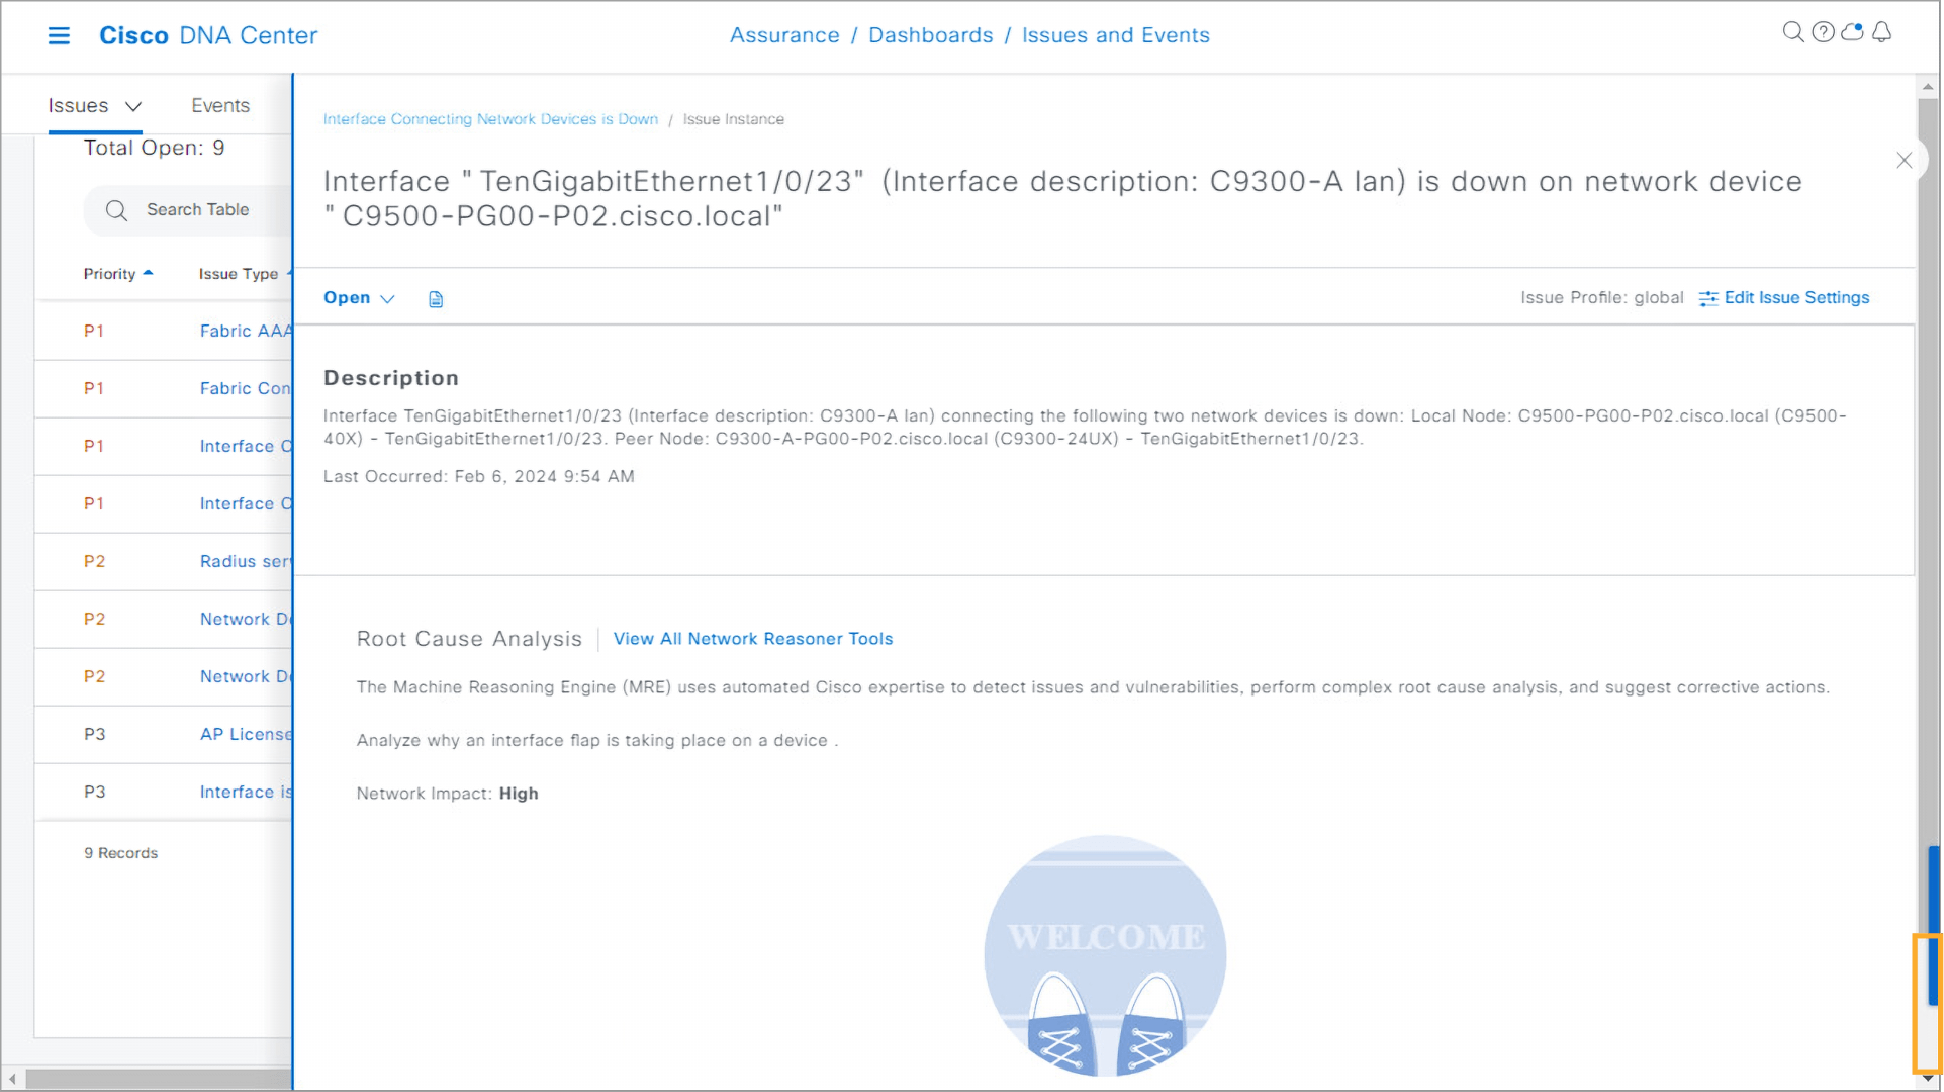
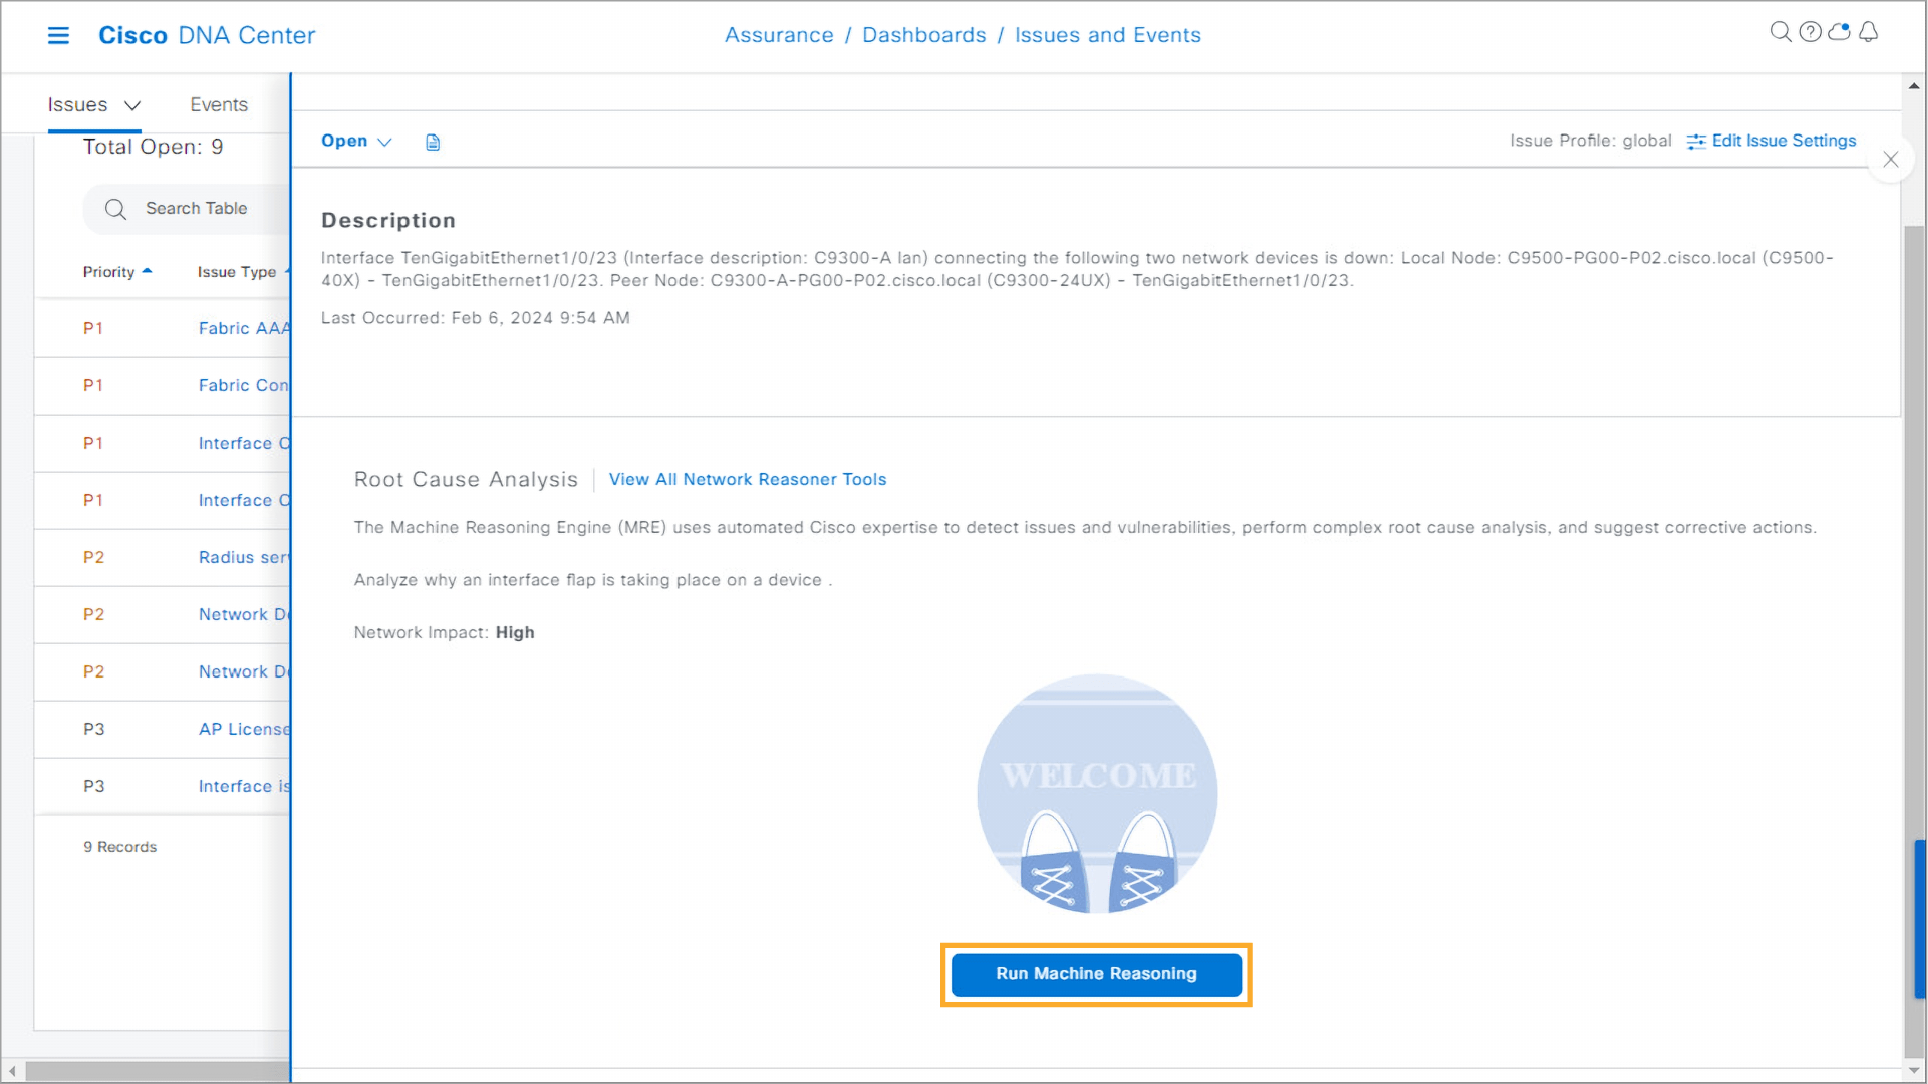
Step 32:
- Click the bottom part of the scroll bar to scroll down to the bottom of the page. Cisco Catalyst Center supports the machine reasoning engine for some issues, including this one. Start the machine reasoning process by clicking the Run Machine Reasoning button.
Step 33:
- You can see that the machine reasoning process includes several steps that Catalyst Center performs to determine the root cause of the issue.
Step 34:
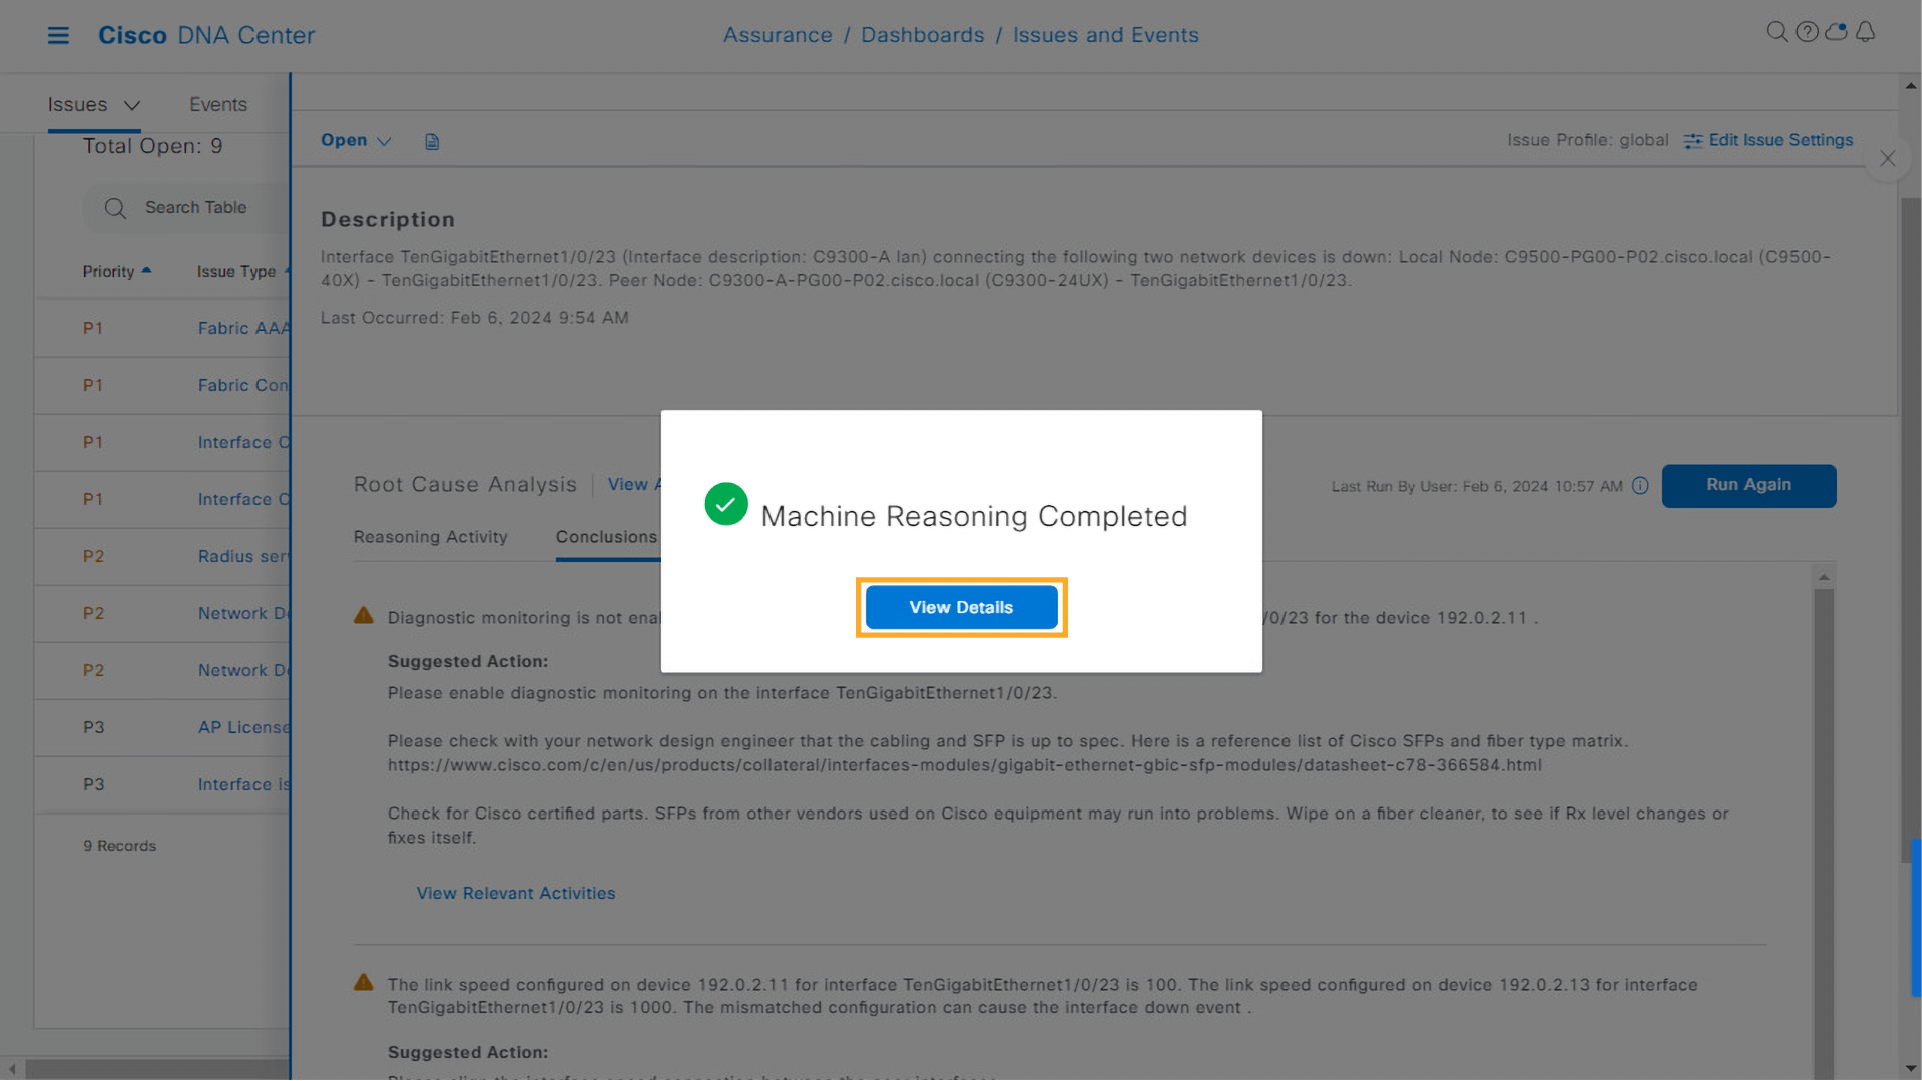
- Click View Details once you see the Machine Reasoning Completed window.
Step 35:
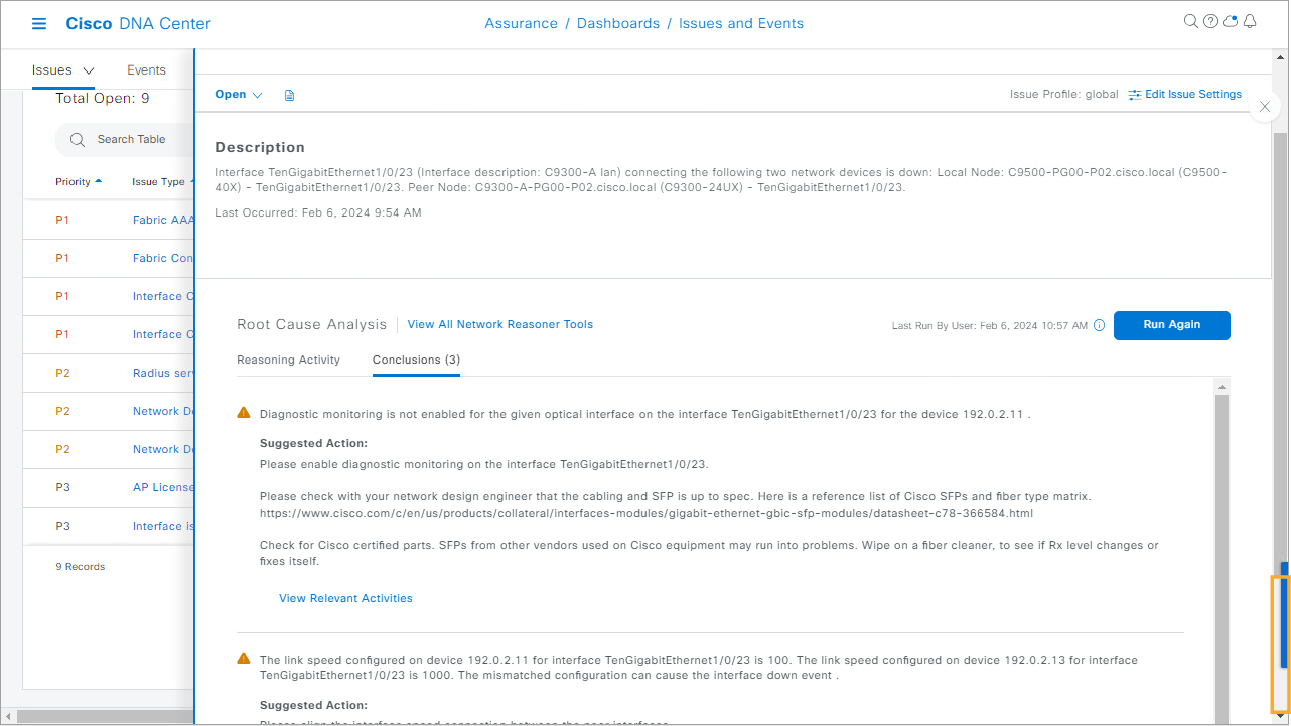
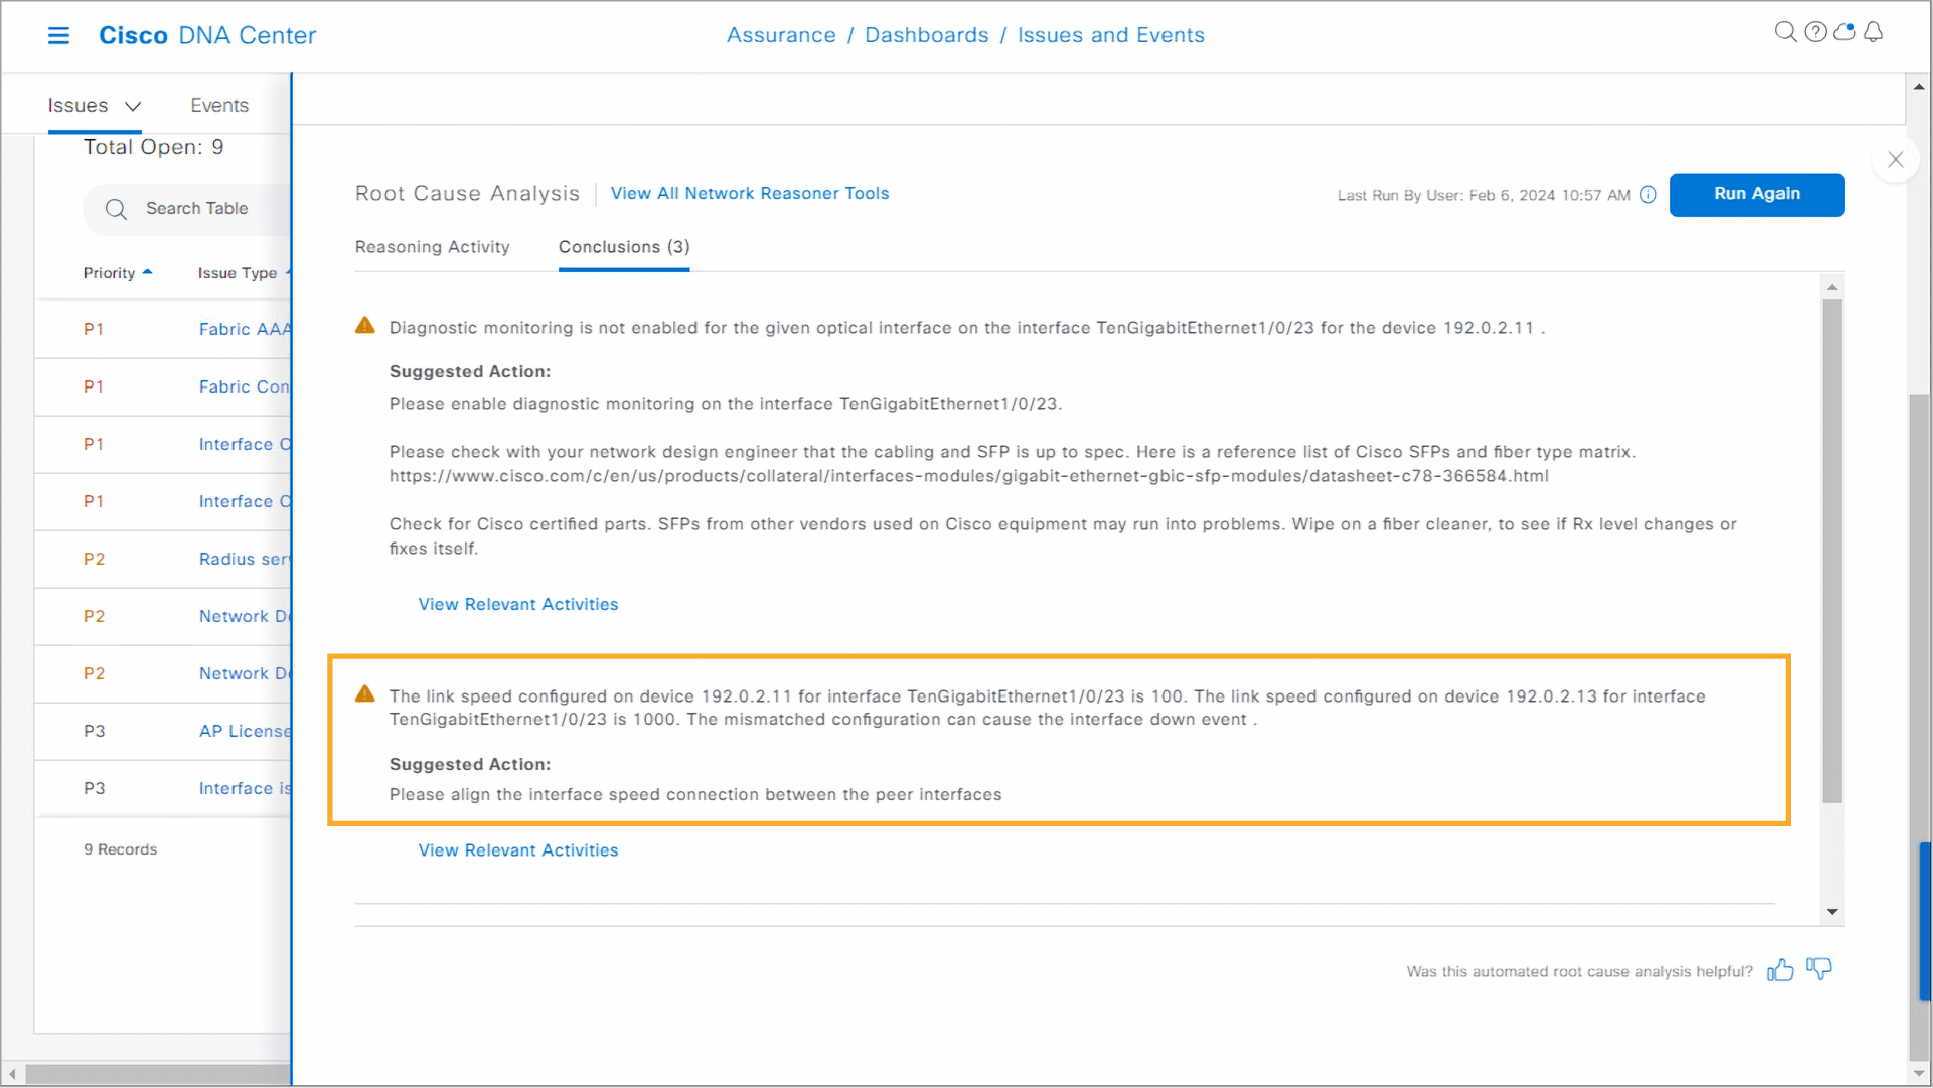
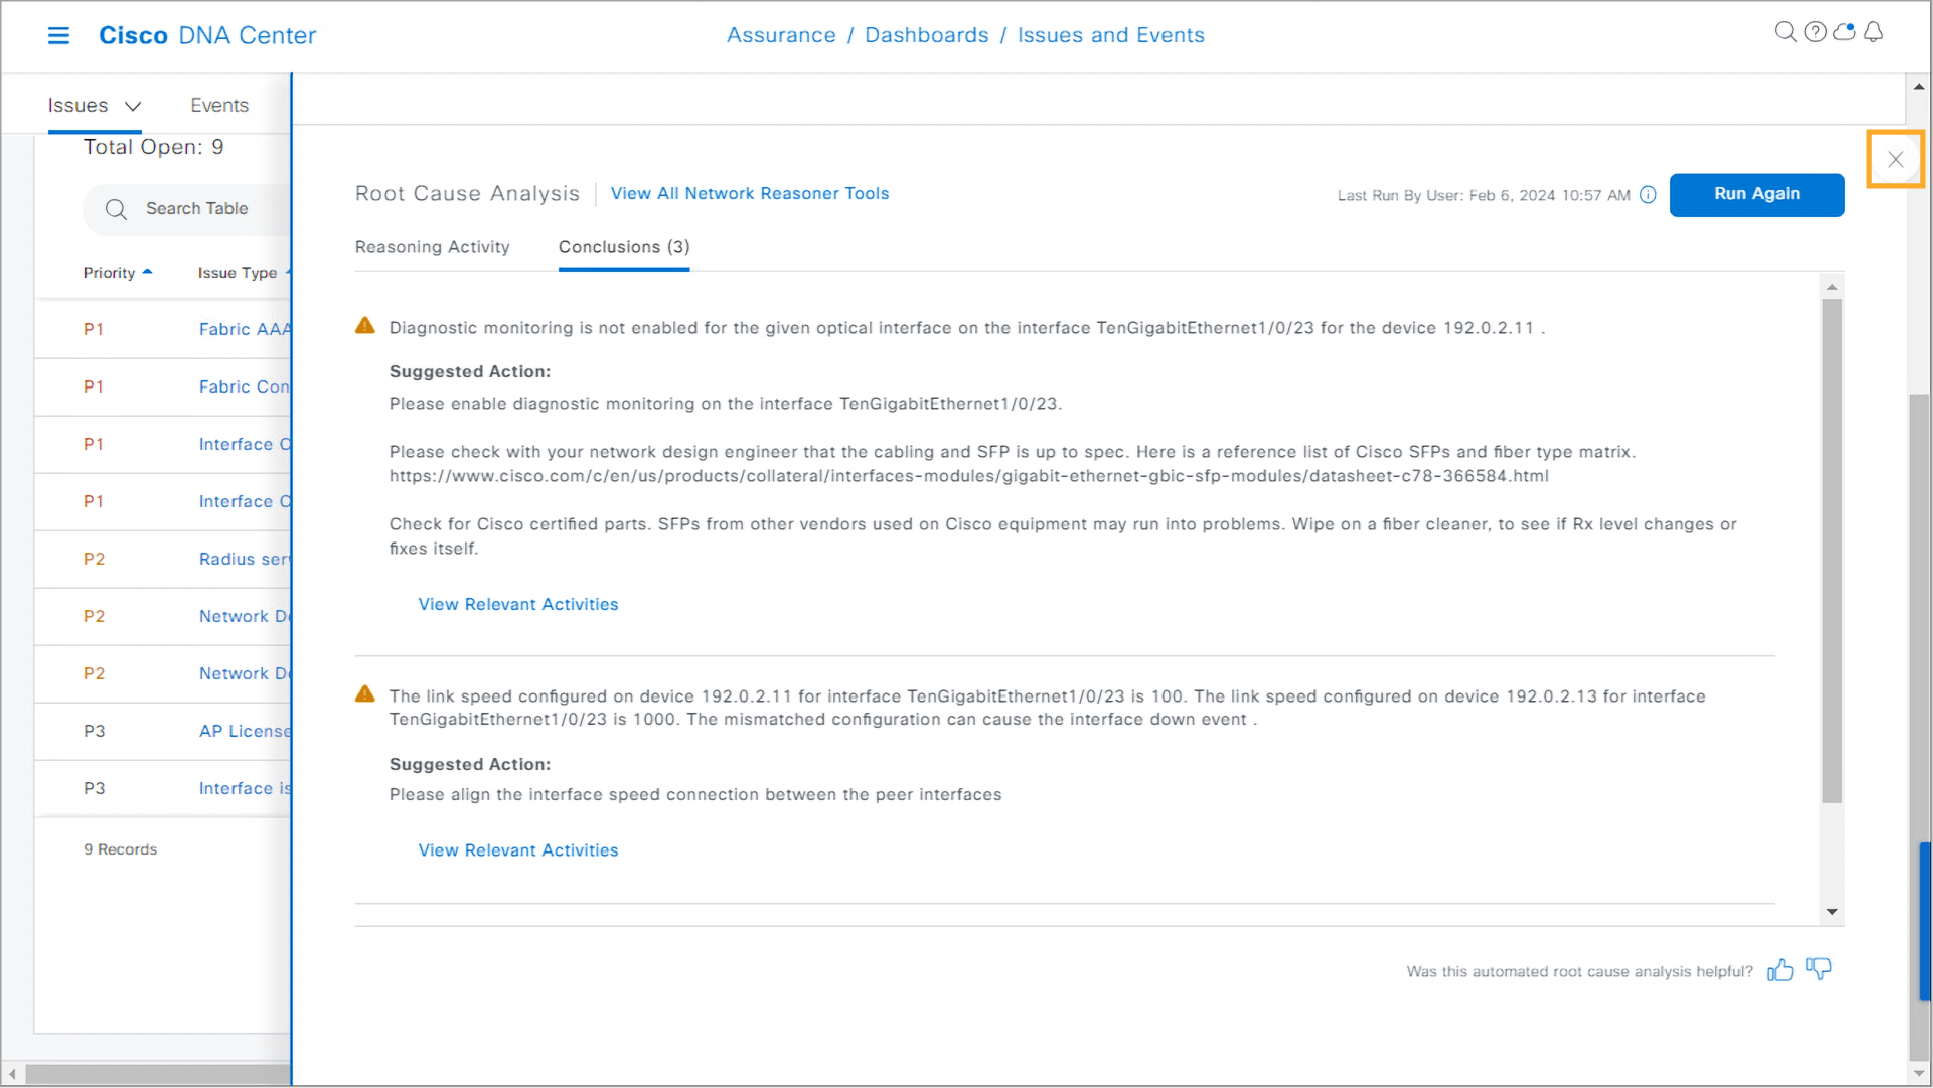
- Click the bottom part of the scroll bar to scroll down and view the bottom of the machine reasoning results page. Observe the conclusions.
- You can see that Catalyst Center determined that the root cause of the issue is the interface speed mismatch on both switches. This very likely caused the interfaces to go down, resulting in the loss of network connectivity from the affected access switch.
Step 36:
- Click X in the upper-right corner of the window to close the issue details window.
Note: To continue with Step 37, proceed to the next topic.
During the next several steps, you will use the Catalyst Center Command Runner to examine the configured speed of the TenGigabitEthernet1/0/23 interface on the C9300-A and C9500 switches. This way, you can verify if this is really the cause of the interfaces going down.
Step 37:
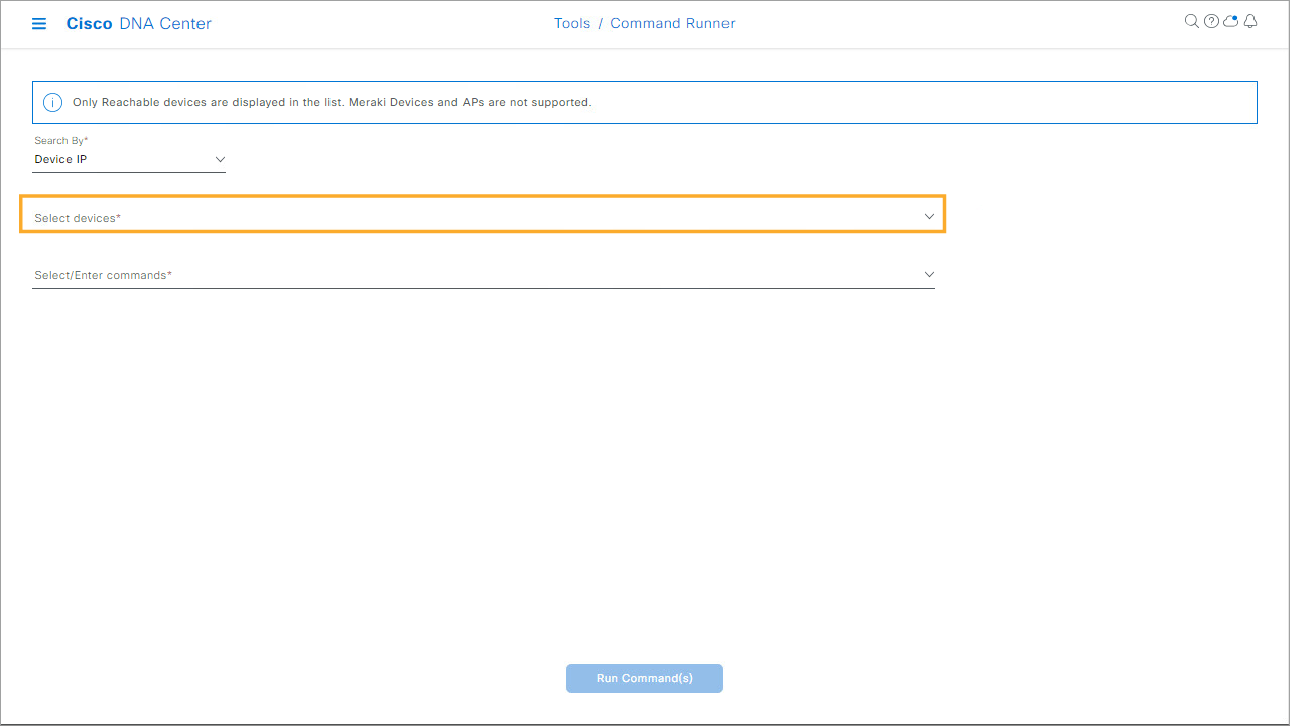
- In the Catalyst Center menu, navigate to Tools > Command Runner.

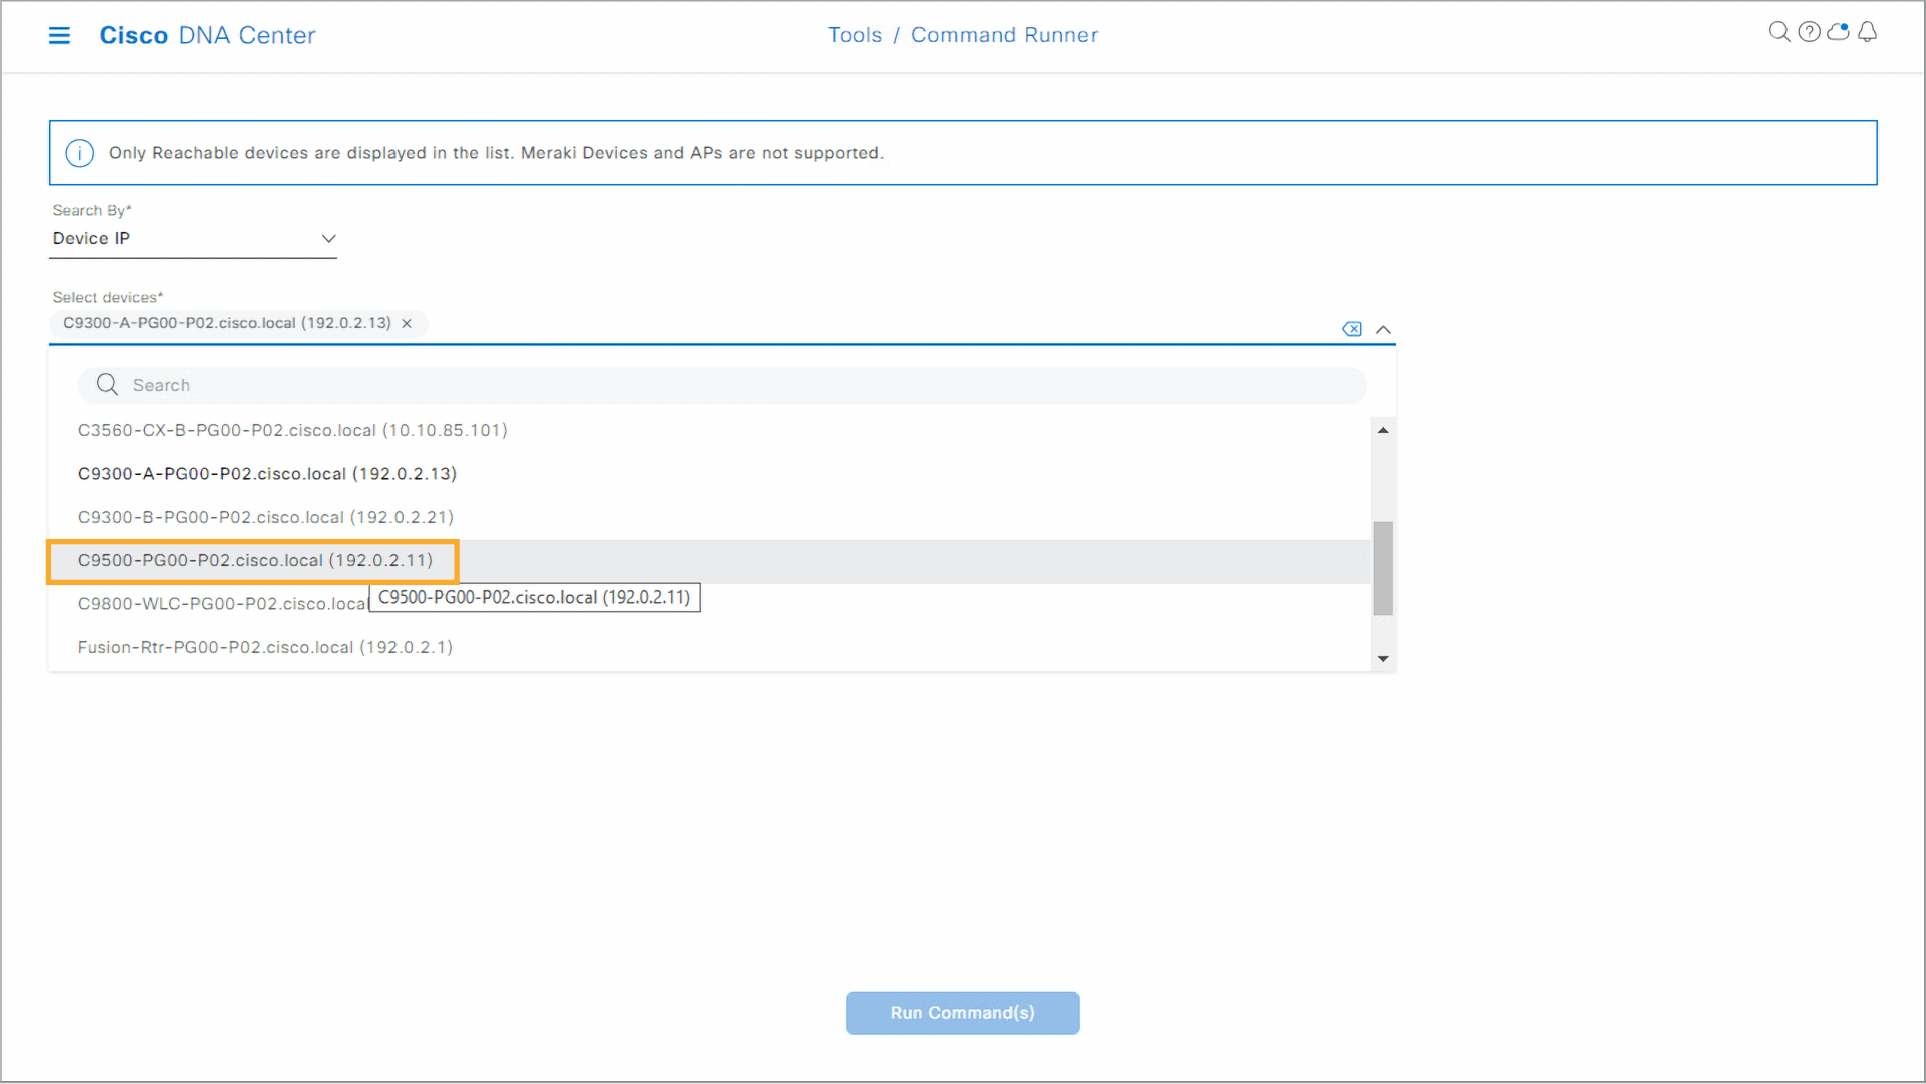
Step 38:
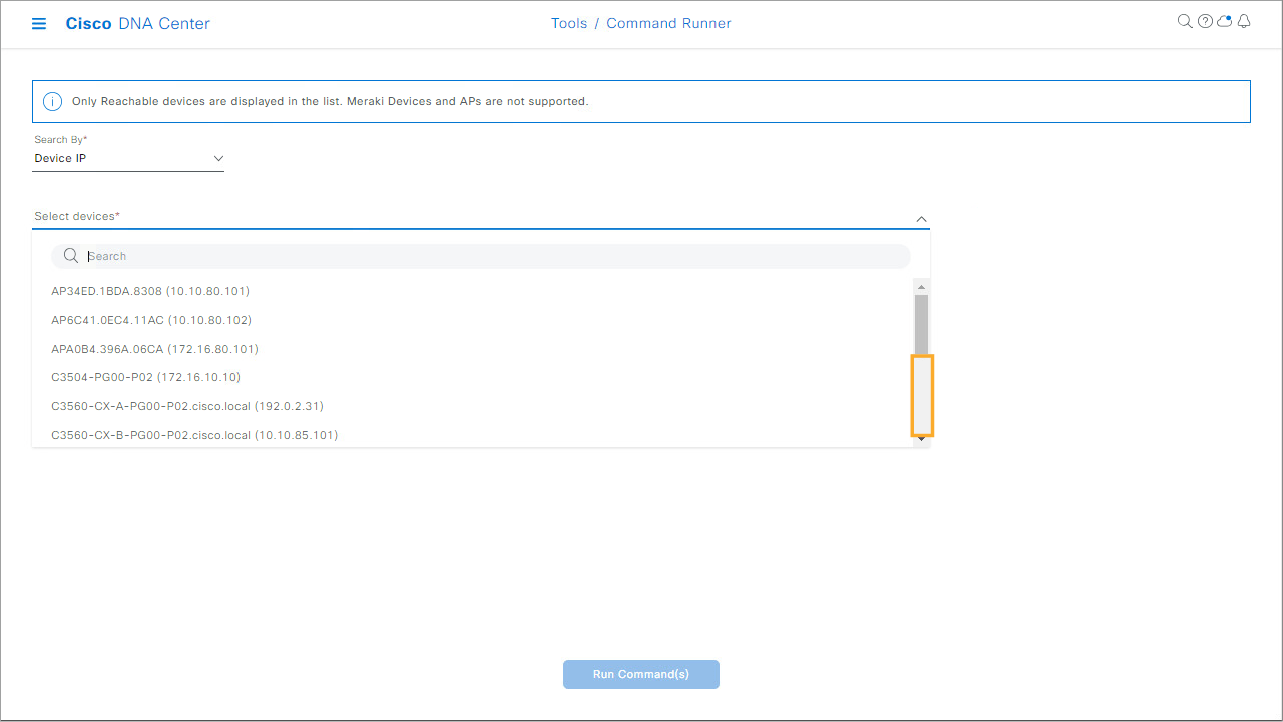
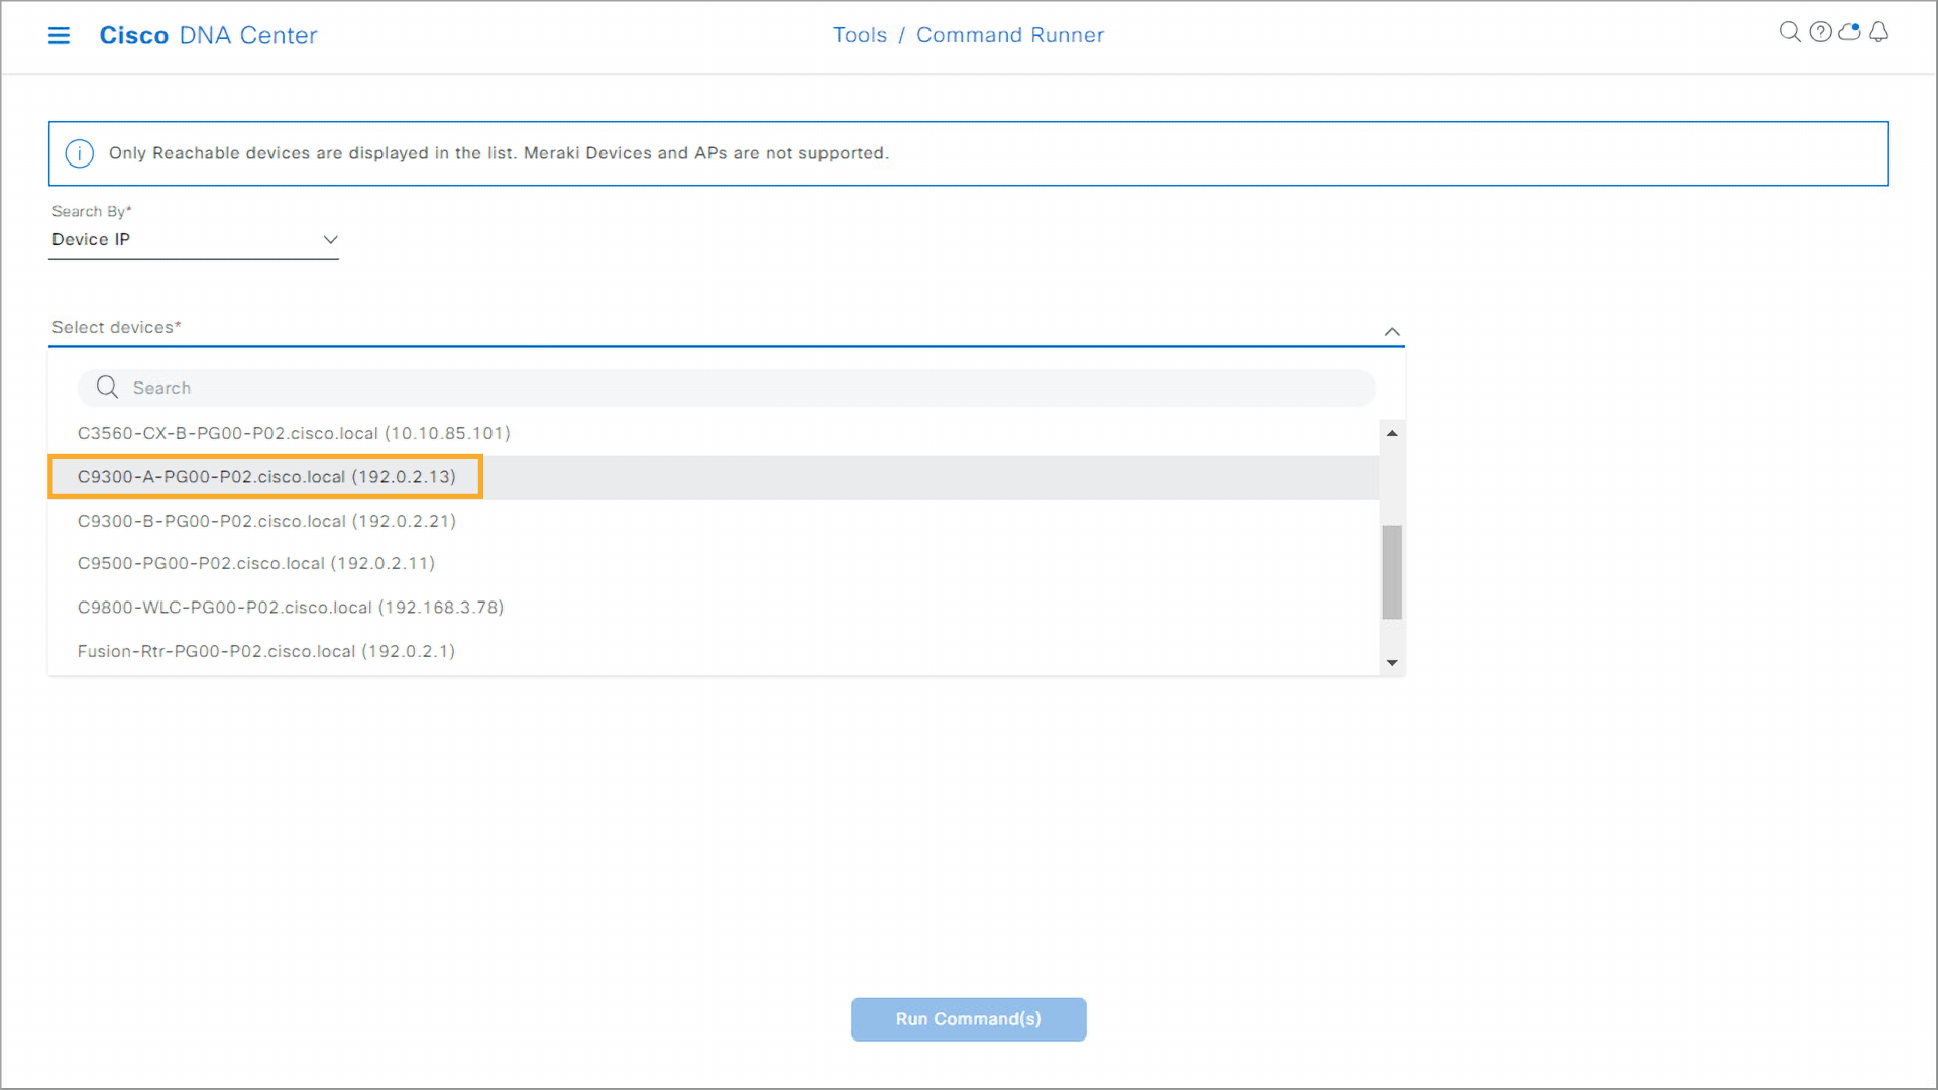
- Click the Select devices drop-down menu. In the menu that appears, click the bottom of the scroll bar to scroll down. Click the C9300-A switch.
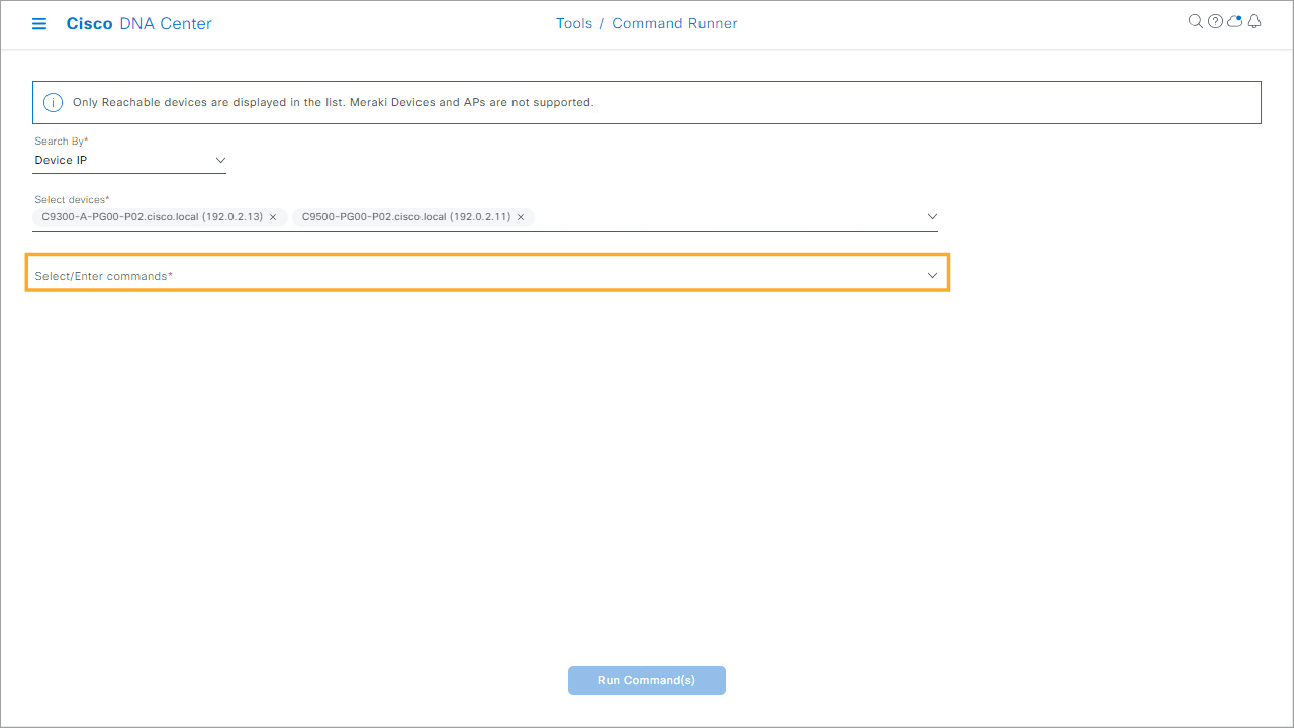
Step 39:
- From the same menu, also click the C9500 switch.
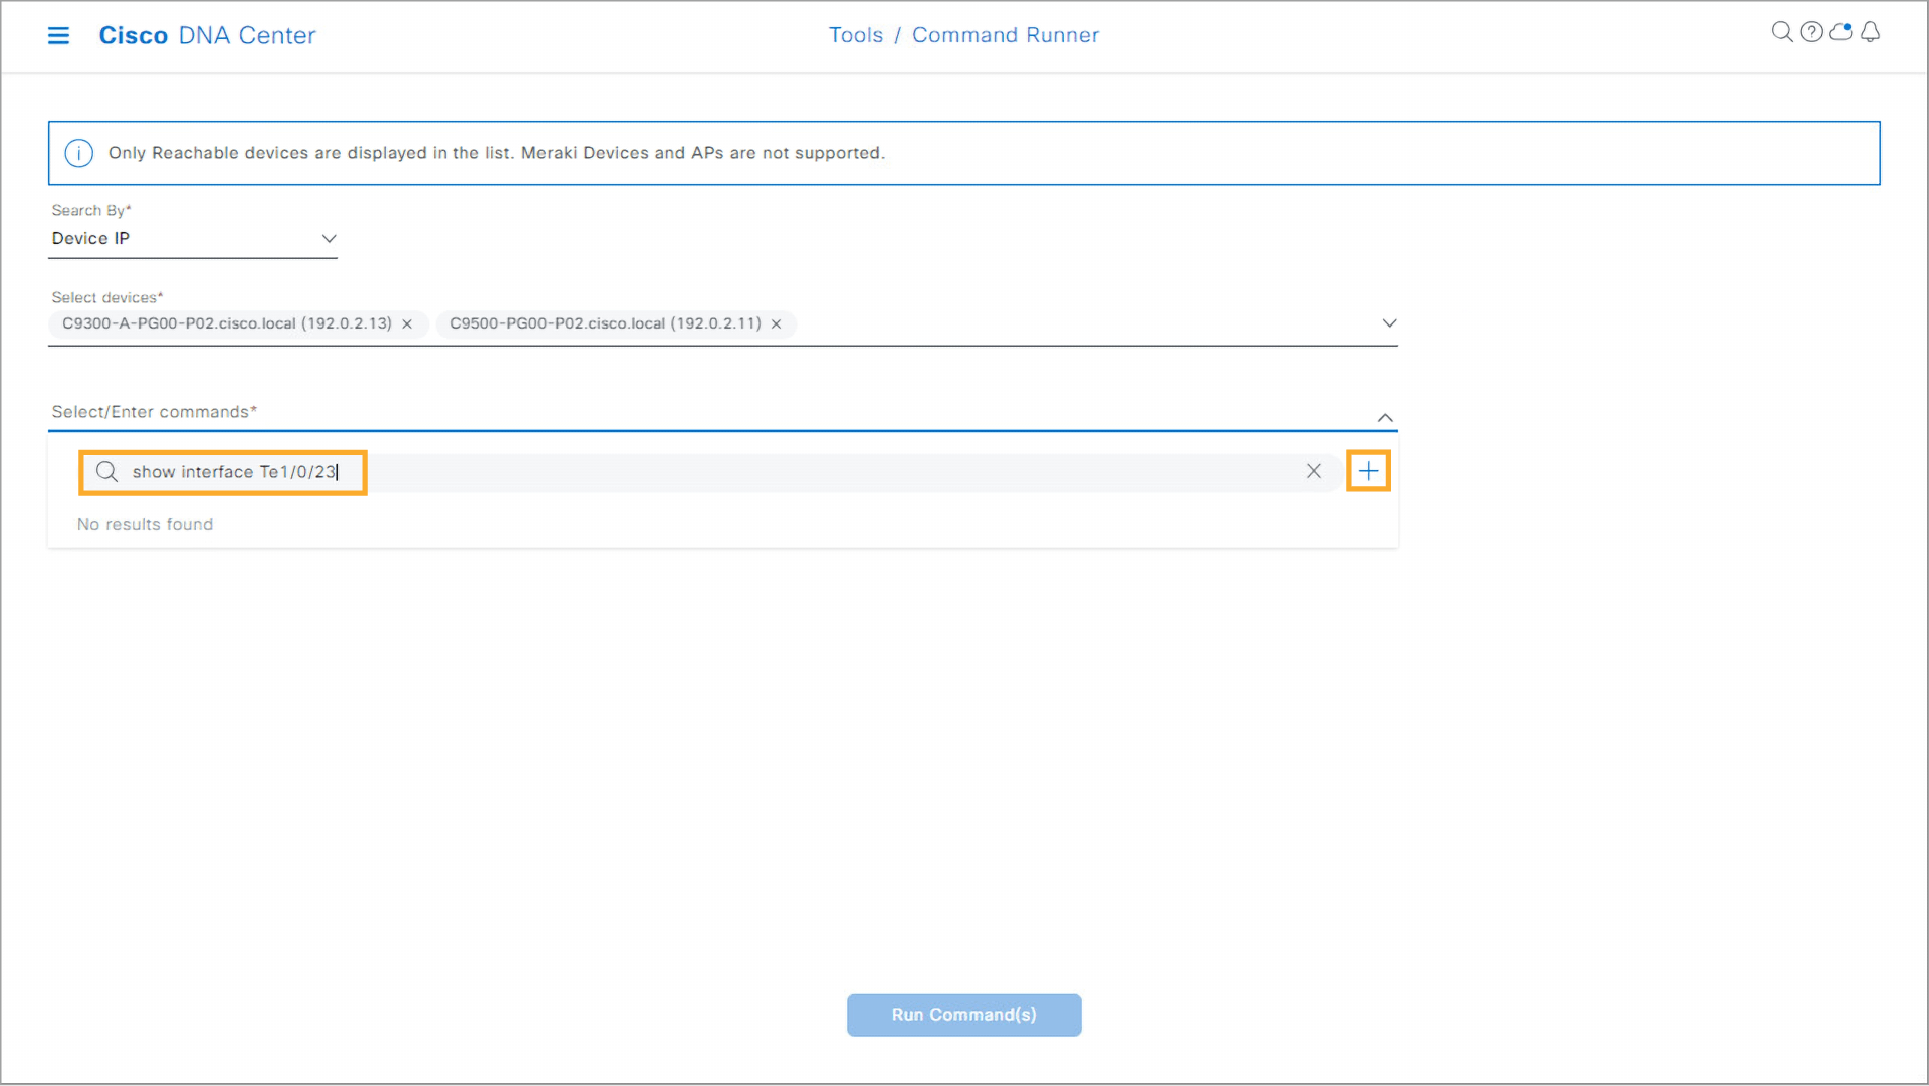
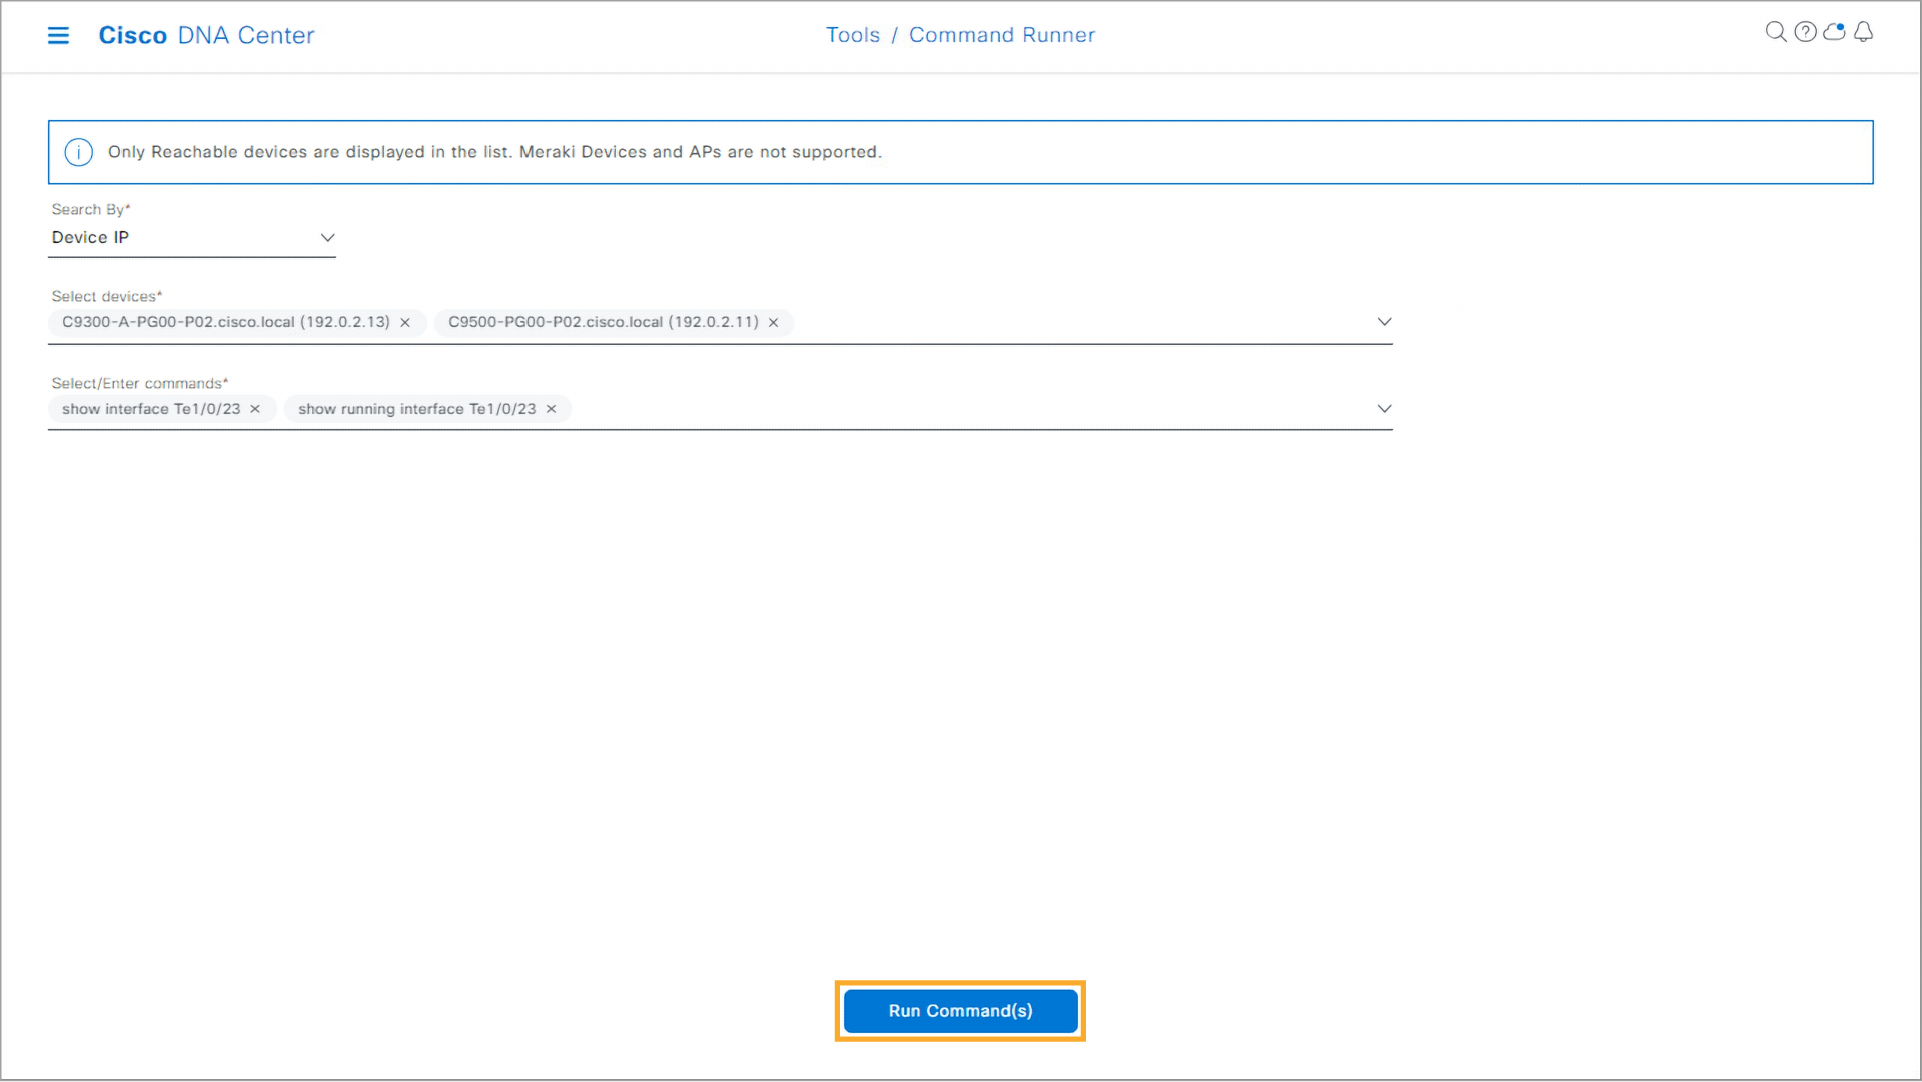
Step 40:
- Click the Select/Enter commands drop-down menu. Type
show interface Te1/0/23next to the magnifying glass icon and press Enter. When the command shows up, click the + icon.
Step 41:
- Next, enter the
show running interface Te1/0/23command next to the magnifying glass icon again. Press Enter and click the + icon.
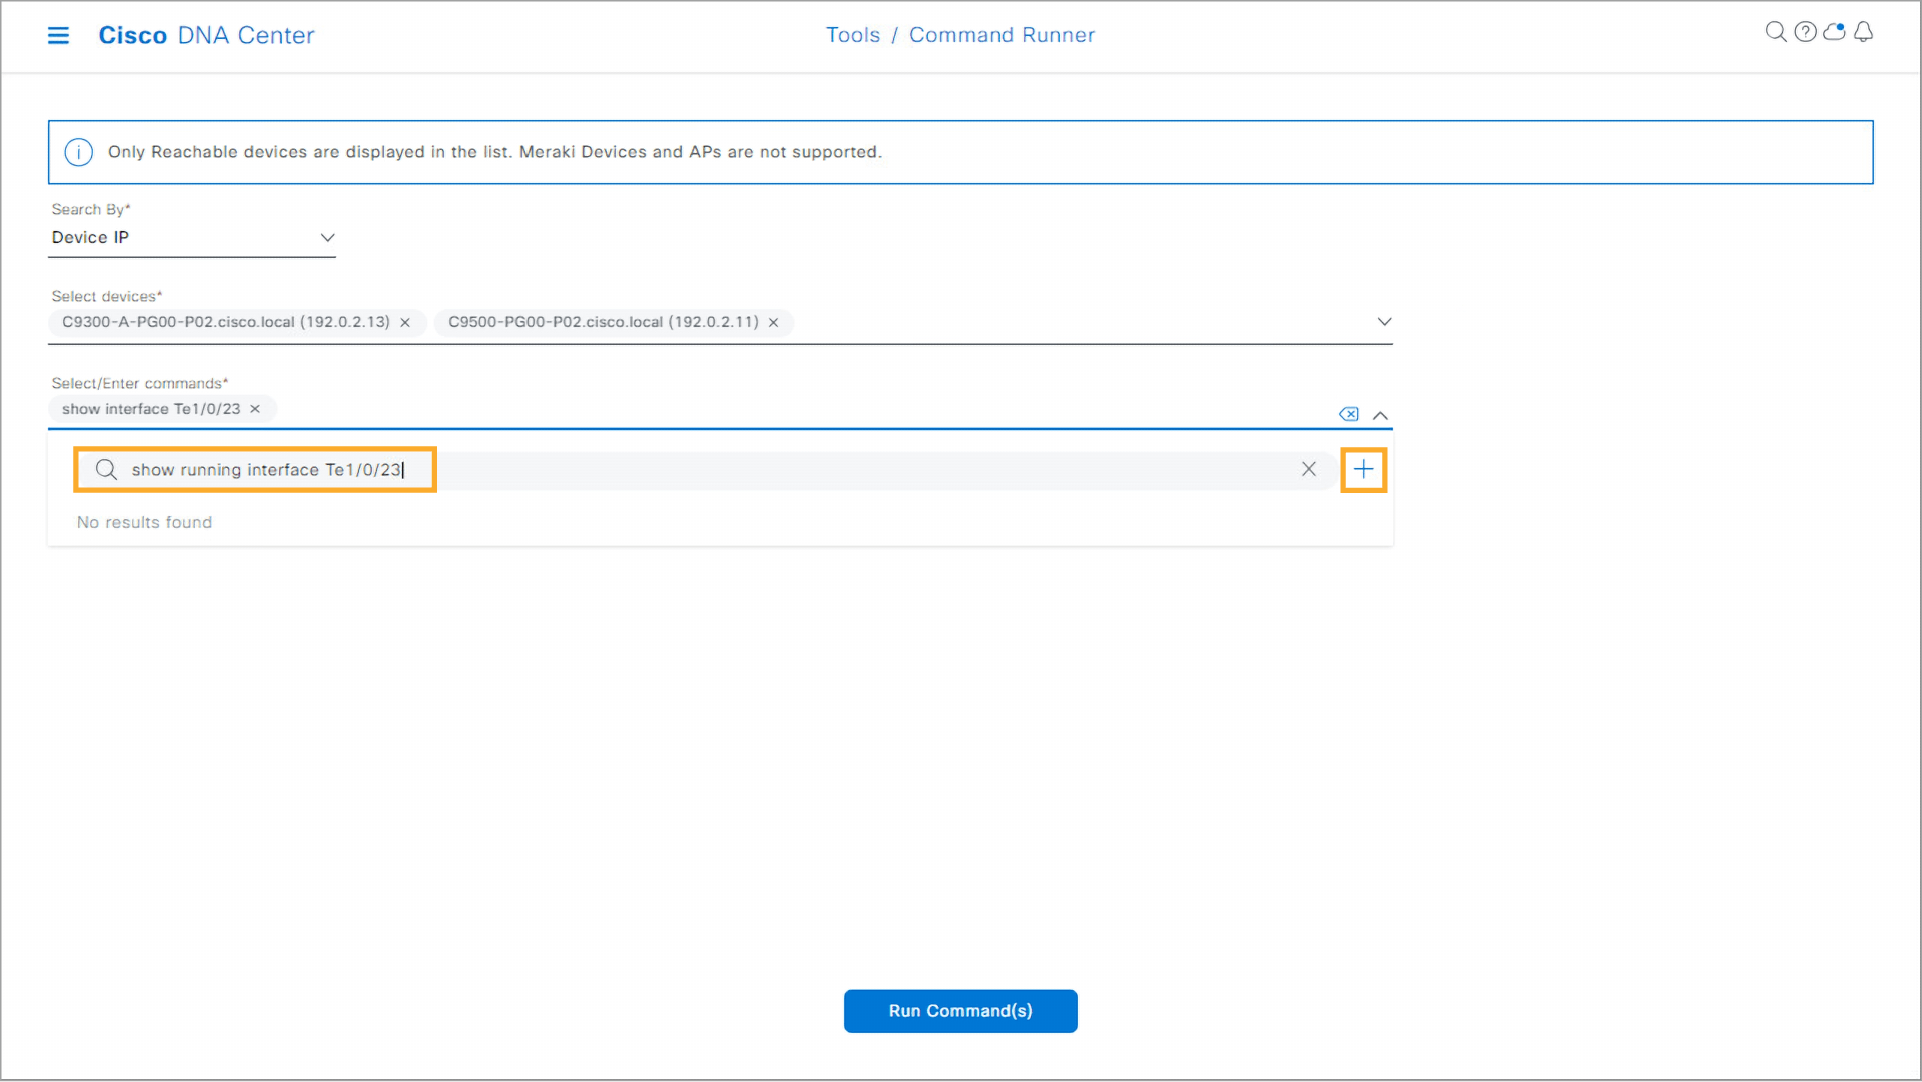
Step 42:
- Inside the Command Runner, click the Run Command(s) button.
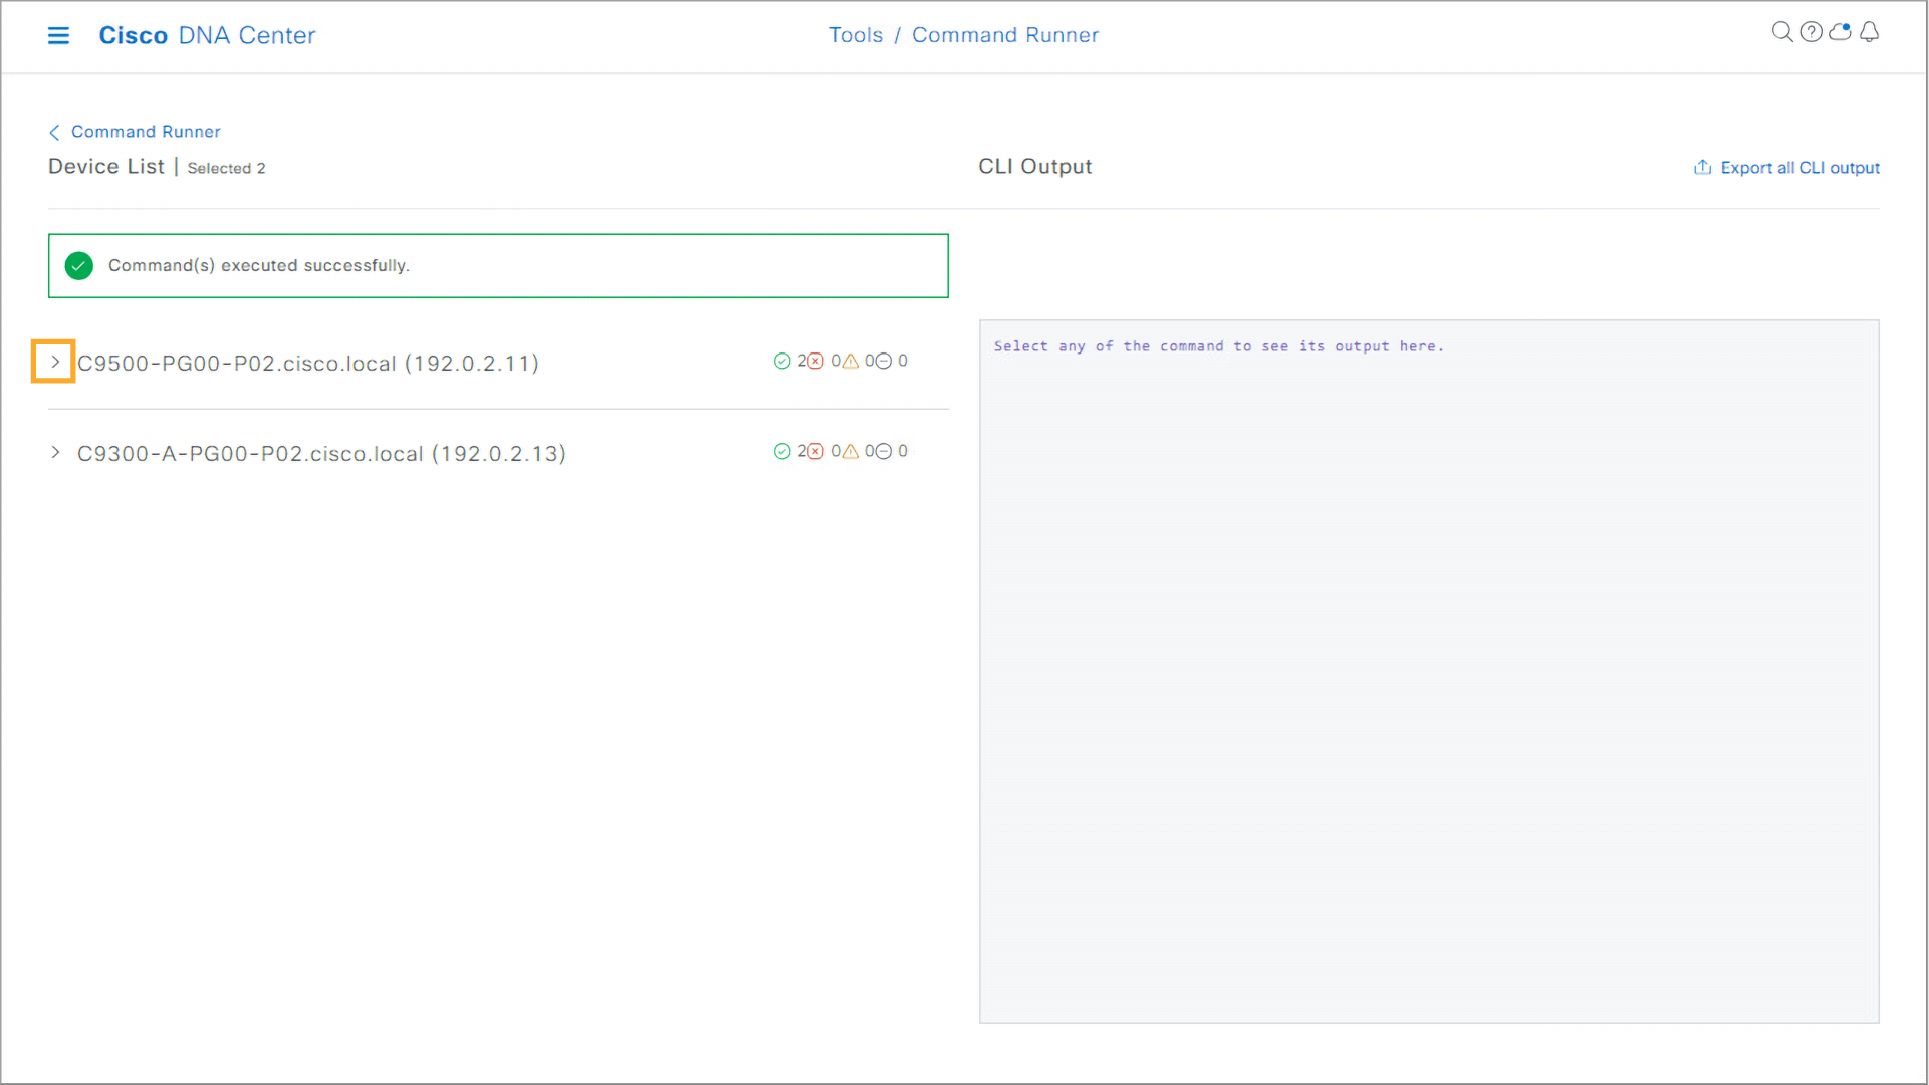
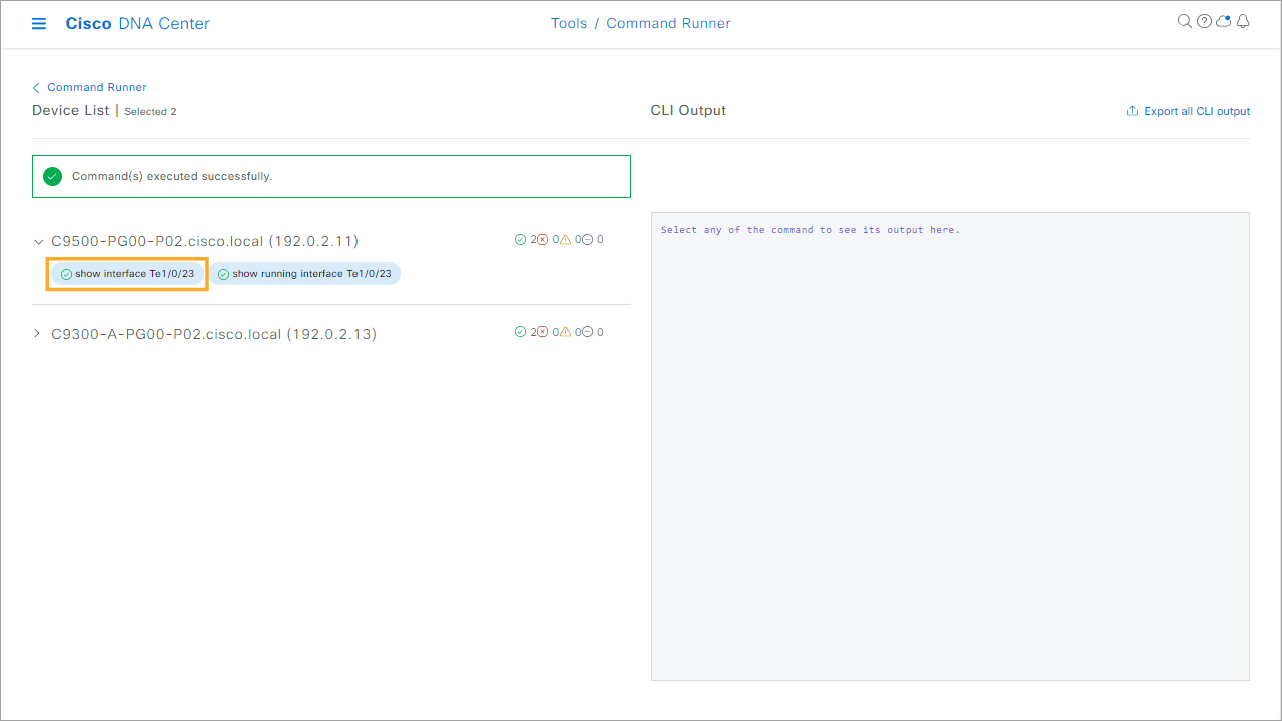
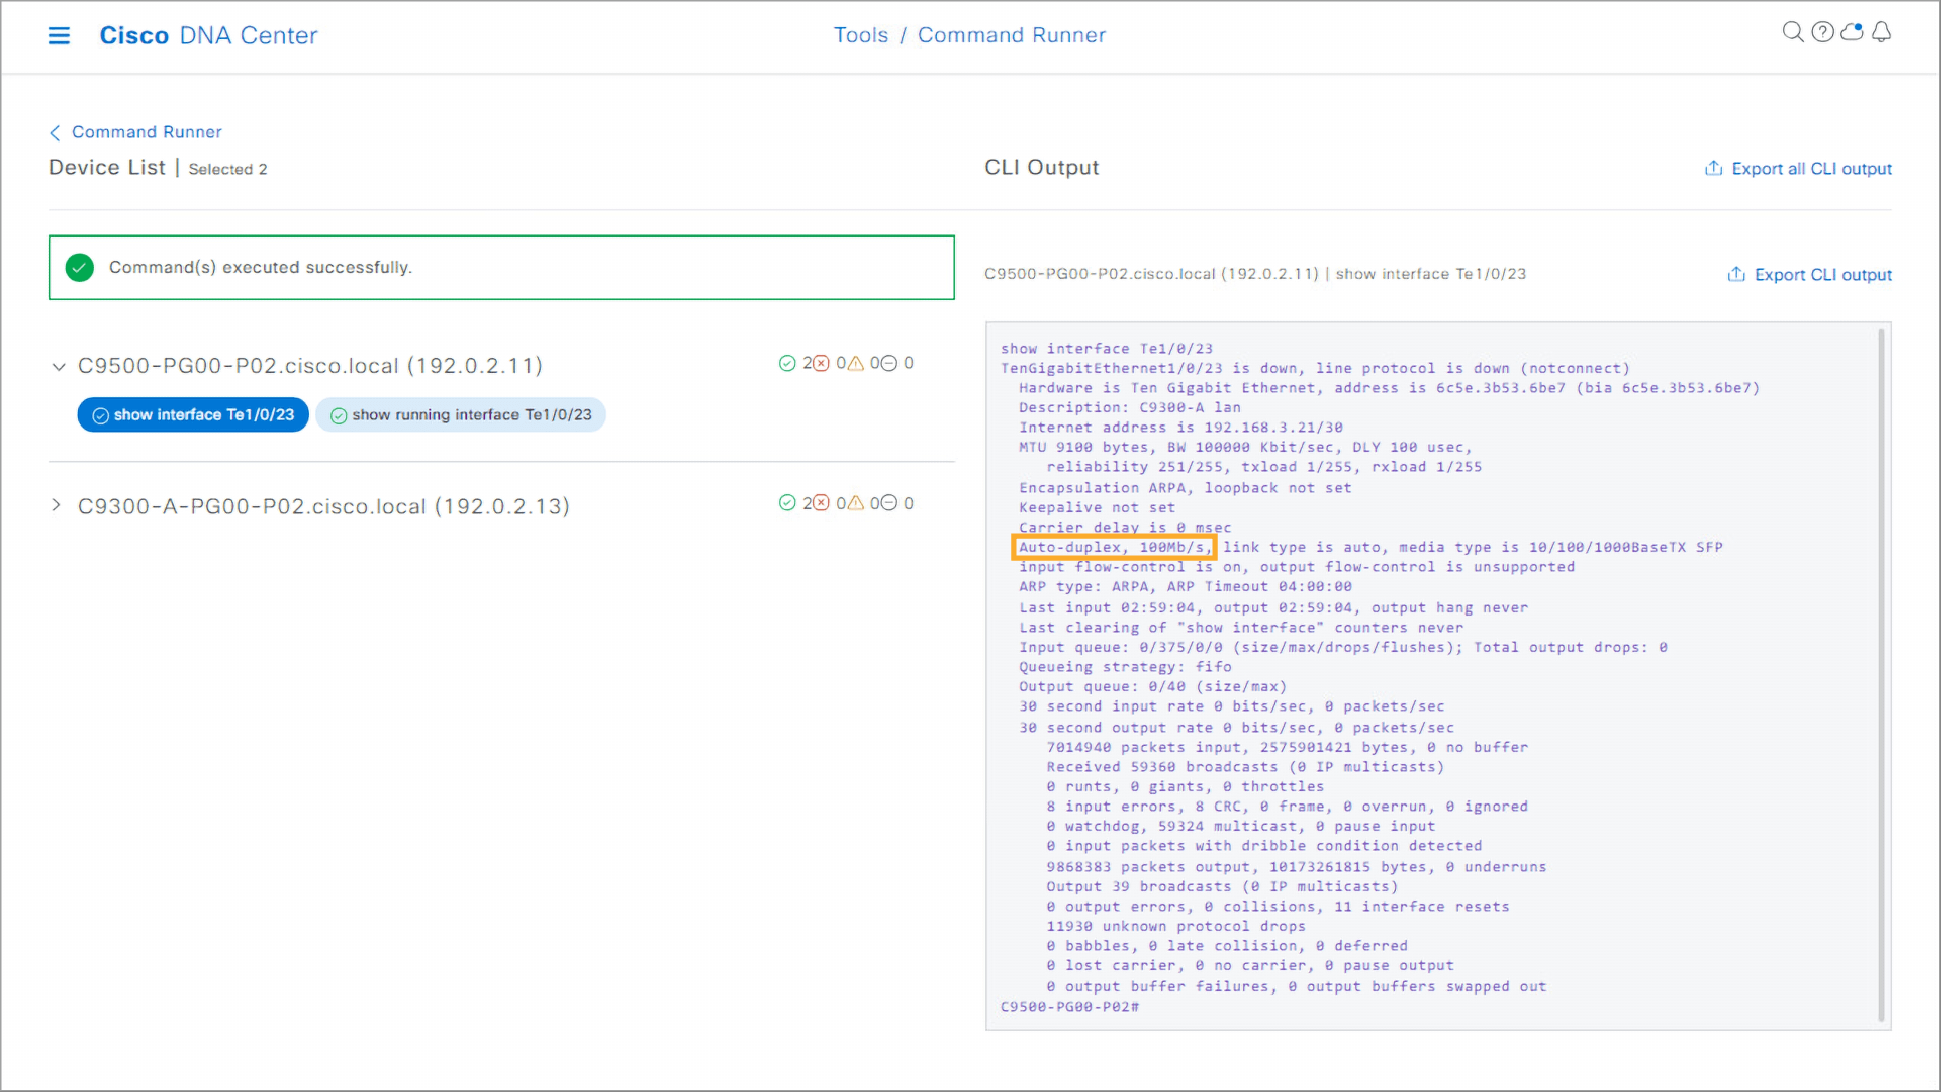
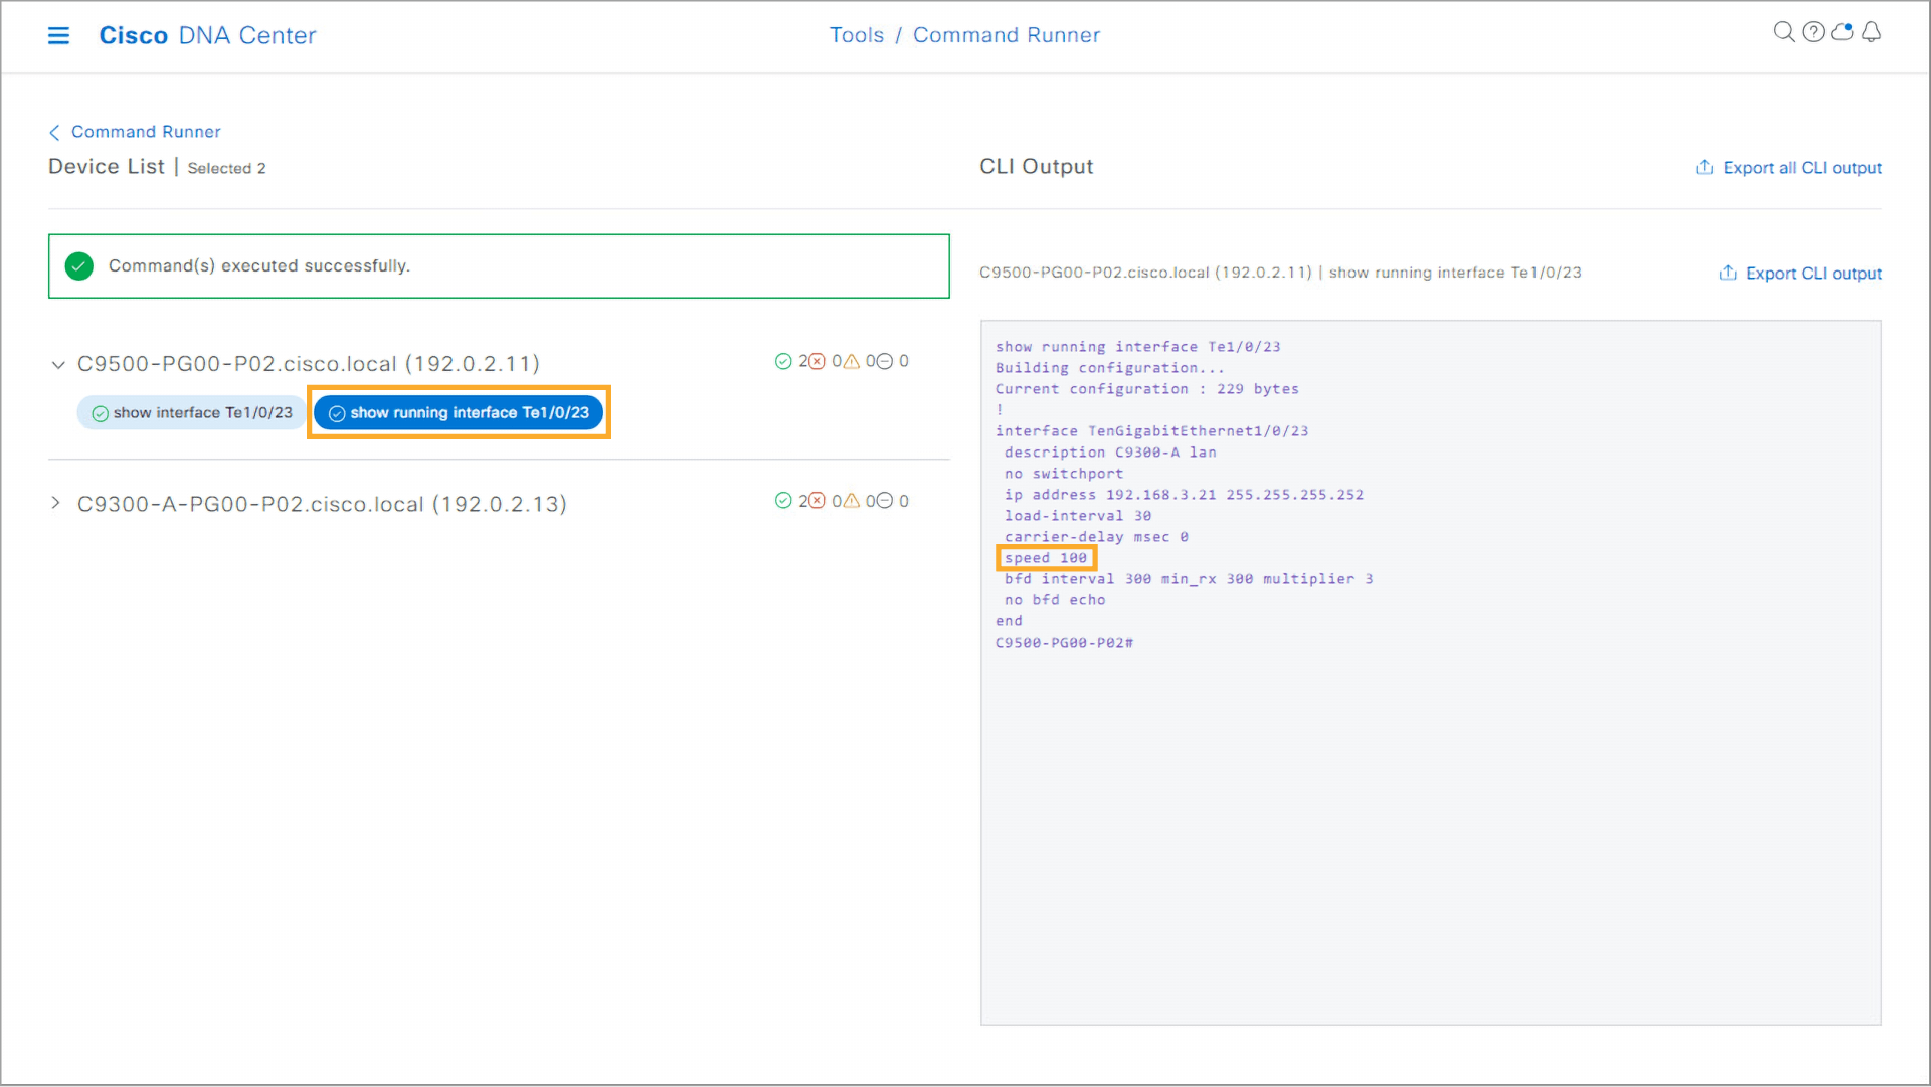
Step 43:
- Expand the arrow to the left of the C9500 switch name and click the blue button with the
show interface Te1/0/23text. Observe the output on the right. Notice that the speed of the interface is set to 100 Mb/s.
Step 44:
- Click the blue button with
show running interface Te1/0/23text. Observe the output on the right. As you can see, the speed of the interface was manually set to 100 Mb/s.
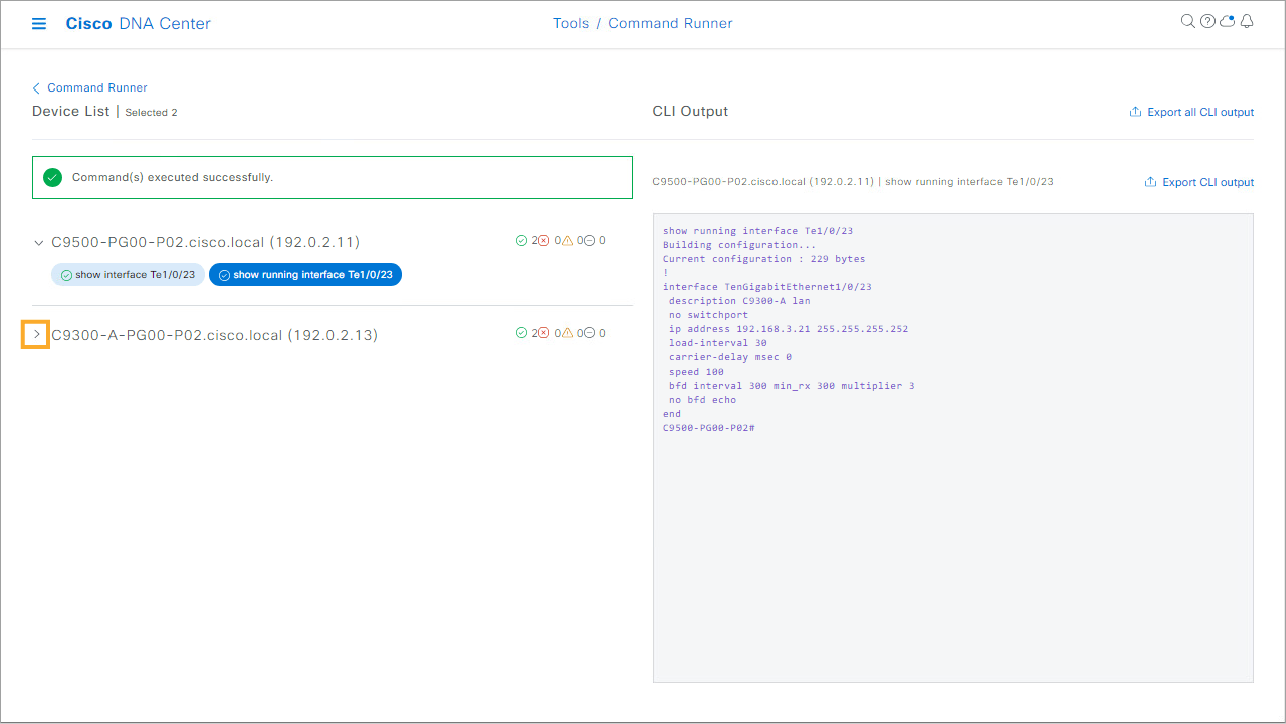
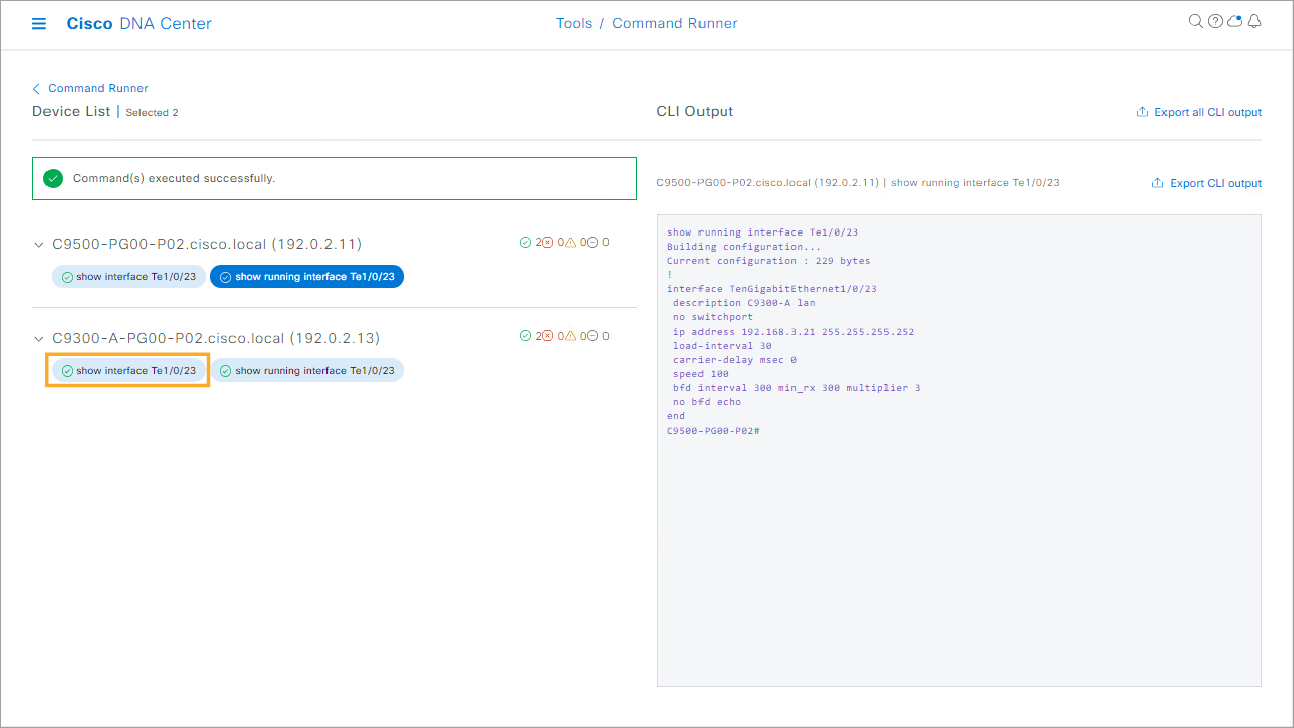
Step 45:
- Expand the arrow to the left of the C9300-A switch name and click the blue button with the
show interface Te1/0/23text. Observe the output on the right. Notice that the speed of the interface on this switch is set to 1000 Mb/s.
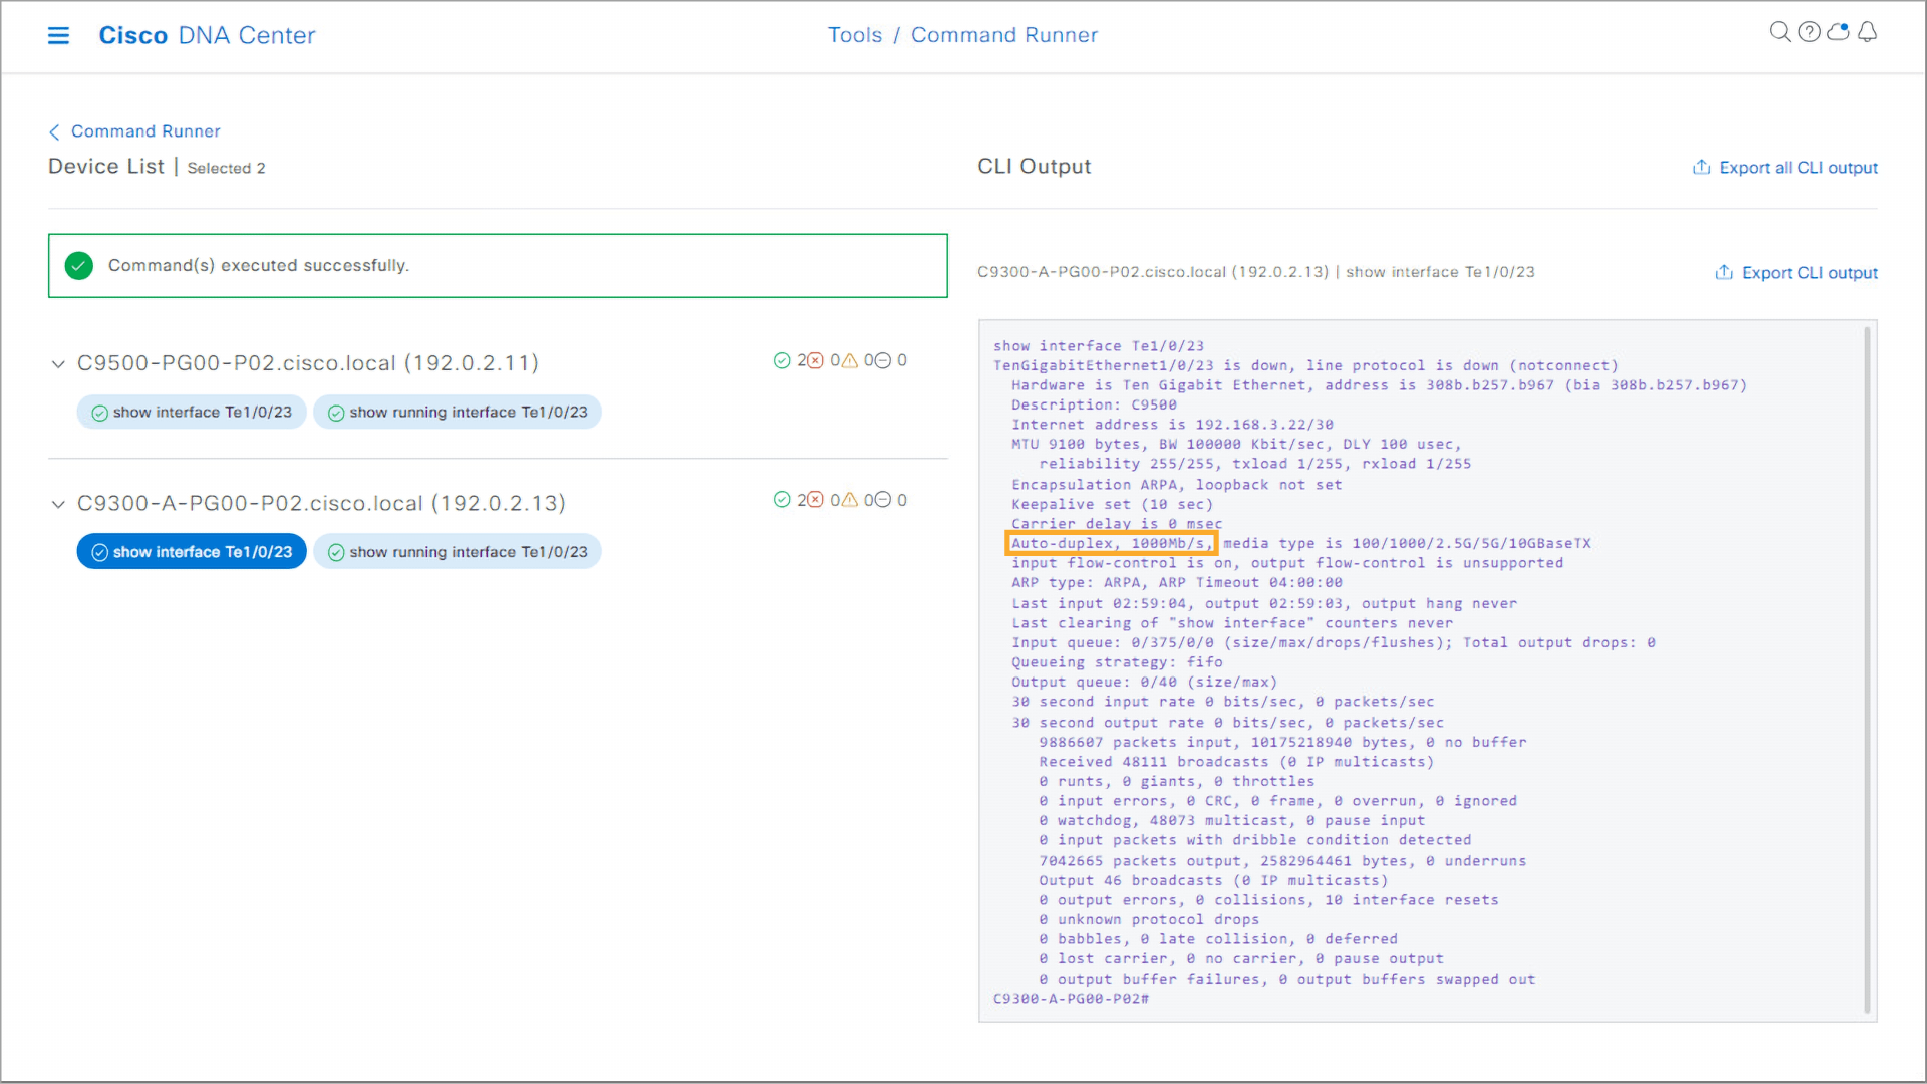
Step 46:
- Click the blue button with the
show running interface Te1/0/23text. Observe the output on the right. Notice that the speed of the interface was manually set to 1000 Mb/s.
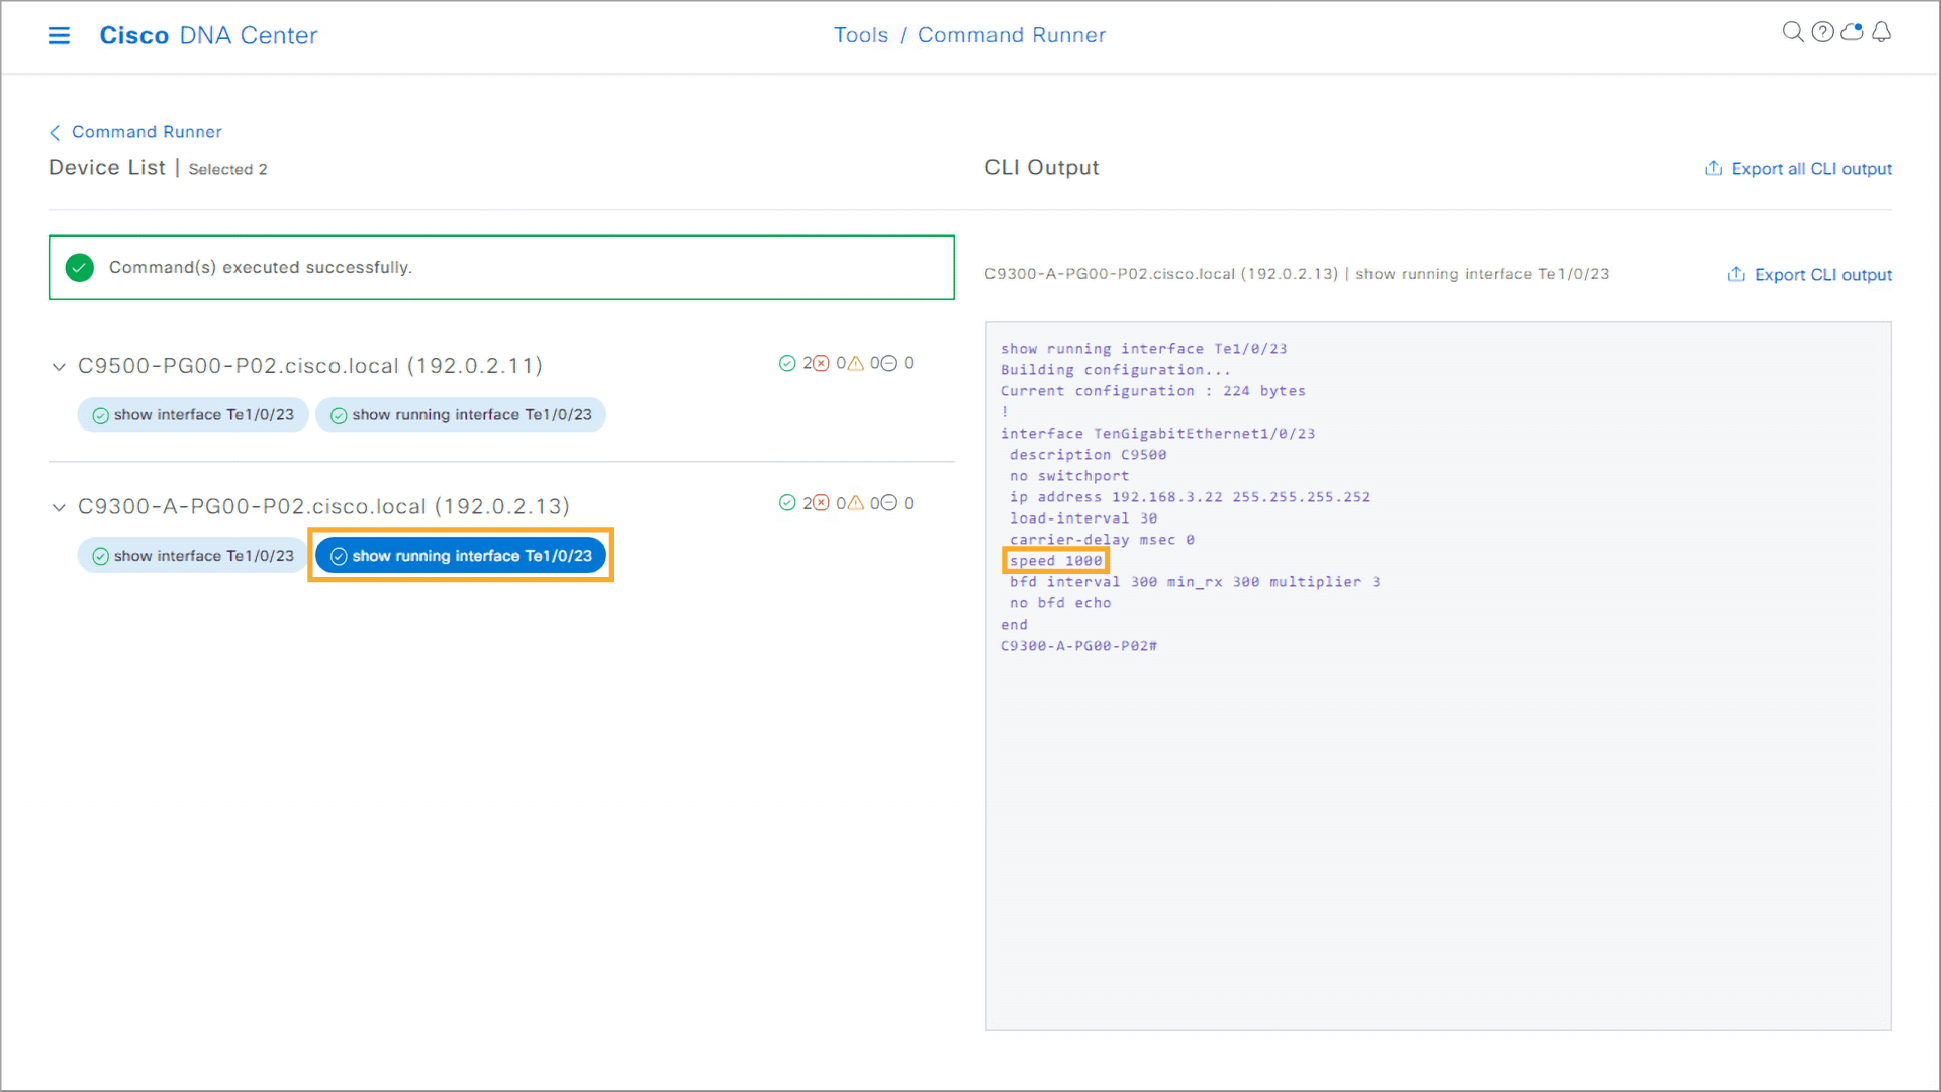
You can see that the misconfigured speed settings on both switches resulted in interfaces going down, causing the loss of network connectivity from the access switch. The next step would be to connect to both switches and set speed on both sides to the same value or set the speed to auto to allow autonegotiation to set the same speed on both sides of the connection.
Step 47:
- To exit the simulation, press the Exit Lab Mode button.
You’ve completed this tutorial, advancing in your learning journey. To continue building your networking skills, check out our additional tutorials, courses, and learning paths.
Why Create a Free Cisco U. Account?
A Cisco U. account helps you:
Personalize training: Set your learning goals and pace.
Track progress: Monitor your achievements and learning milestones.
Resume anytime: Continue your learning exactly where you stopped.
Further Learning Resources
Explore more on Cisco U.:
Training Resources
- Designing and Implementing Enterprise Network Assurance (300-445 ENNA) is a 90-minute exam associated with the CCNP Enterprise Certification.
Need Help or Want to Engage?
To ask questions and share ideas, join our Cisco Learning Community.
For technical issues, feedback, or more resources, visit our Cisco U. Support page.
Finishing Up
Don’t forget to click Exit Tutorial to log your completed content.